
Alaska Airlines
AS · ASAAlaska Airlines carries about 53.9M passengers a year on 248 aircraft, the 5th-largest US airline by passengers flown. Its busiest airport is Seattle.
Passengers flown a year
53.9M
#5 US airline by passengers
248
aircraft
199
nonstop destinations
18
countries served
10.6 yr
average fleet age
79.6%
arrivals on time
82.1%
load factor
Market position
Alaska Airlines flew 5.6% of all US passengers over the past year — the 5th-largest share of any carrier.
Share of all US passengers flown · each carrier a slice of the market · Alaska Airlines is the ringed slice at 5.6%
Where Alaska Airlines flies
What Alaska Airlines actually flew — departures, seats, and passengers filed with the US DOT, the live complement to the fleet it owns.
Departures
498,156
12 months to July 2026
Seats flown
67,829,898
Passengers
53.9M
Load factor
82.1%
RPM ÷ ASM
Busiest Alaska Airlines routes
27 flights a day · 1,322,378 passengers
80.5%
full
18 flights a day · 880,460 passengers
78.4%
full
16 flights a day · 849,976 passengers
84.9%
full
22 flights a day · 810,309 passengers
78.8%
full
15 flights a day · 789,998 passengers
84.2%
full
15 flights a day · 776,963 passengers
84.3%
full
14 flights a day · 756,782 passengers
84.1%
full
14 flights a day · 689,402 passengers
84.7%
full
Bars are seats added or cut; the figure is the percentage. Comparing August 2025–July 2026 against August 2024–July 2025. Routes the airline started or dropped mid-year are left out — a percentage between a partial year and a full one measures whether the route existed, not how its capacity changed.
Where Alaska Airlines dominates
Alaska Airlines carries a commanding share of the passengers at its fortress hubs — a clearer read on its power than raw fleet size. Share is of every carrier's passengers at that airport, including its regional feeders; on time is that hub's own arrival rate.
- ANC
Anchorage
3.8M3,842,715 passengers · 80.1% on time
69%
of airport
80.1%
on time
- SEA
Seattle
25.7M25,747,907 passengers · 79.2% on time
51%
of airport
79.2%
on time
- PDX
Portland
9.3M9,269,998 passengers · 84.8% on time
50%
of airport
84.8%
on time
- OGG
Kahului
2.4M2,425,931 passengers · 80.9% on time
35%
of airport
80.9%
on time
- HNL
Honolulu, Oahu
5.8M5,818,288 passengers · 74.7% on time
28%
of airport
74.7%
on time
- SAN
San Diego
5.9M5,858,099 passengers · 77.0% on time
22%
of airport
77.0%
on time
- SFO
San Francisco
4.4M4,410,006 passengers · 65.6% on time
8%
of airport
65.6%
on time
- LAX
Los Angeles
4.8M4,823,302 passengers · 78.2% on time
7%
of airport
78.2%
on time
The fleet
Alaska Airlines reports 248 airframes across 5 types, averaging 10.6 yr. Click through for every tail number, its delivery date and age.
- In the filing
- 248248 in service · 0 stored
- Average age
- 10.6 yrAcross 248 dated airframes
- Types operated
- 5Largest: Boeing 737 MAX 9
100% narrowbody · by aircraft
| Type | Count | Avg age |
|---|---|---|
| Boeing 737 MAX 9 | 80 | 3.7 yr |
| Boeing 737-900ER | 79 | 10.7 yr |
| Boeing 737-800 | 61 | 18.4 yr |
| Boeing 737-700 | 14 | 25.1 yr |
| Boeing 737 MAX 8 | 14 | 1.6 yr |
On-time performance
Of every 100 Alaska Airlines flights, 80 touch down within 15 minutes of schedule, 19 arrive late, and 1 is cancelled. That is a 79.6% on-time rate across 297.1K arrivals over the trailing 12 months.
Every 100 flights
12 min
average delay
3,488
flights cancelled
297.1K
arrivals measured
What holds flights up
Share of delay minutes
On time, month by month
A
S
O
N
D
J
F
M
A
M
J
J
Darker is better · 72%–84.2%
The weak spot is December 2025, when 72% of arrivals landed on time — 7.6 points below the year. The strongest was April 2026 at 84.2%.
On time vs. peers
Bars scaled to the best performer, not to zero
Alaska Airlines lands 79.6% of its arrivals on time — 1 of 4 peers do better.
Frequently asked
How big is Alaska Airlines's fleet?
Alaska Airlines reports a fleet of about 248 aircraft across 5 types, with an average age of 10.6 yr.
How many passengers does Alaska Airlines carry a year?
Alaska Airlines carries about 53.9M passengers a year, the 5th-largest US airline by passengers flown.
What is Alaska Airlines's biggest hub?
Alaska Airlines's busiest airport is Seattle, where it flies about 51% of all passengers.
How many destinations does Alaska Airlines fly to?
Alaska Airlines serves about 199 nonstop destinations in 18 countries.
How reliable is Alaska Airlines?
About 79.6% of Alaska Airlines flights arrived within 15 minutes of schedule over the trailing 12 months, per US DOT figures.
Trip reports on YouTube
Fliers post trip reports from Alaska Airlines flights to YouTube. These three were matched automatically from public YouTube listings — The Frequent Flier does not host, review, or endorse them.

Sam Chui
I Flew Alaska Airlines’ 5-Stop Milk Run — Here’s What Happened
18:17 · Jul 2026
The Trip Reporter
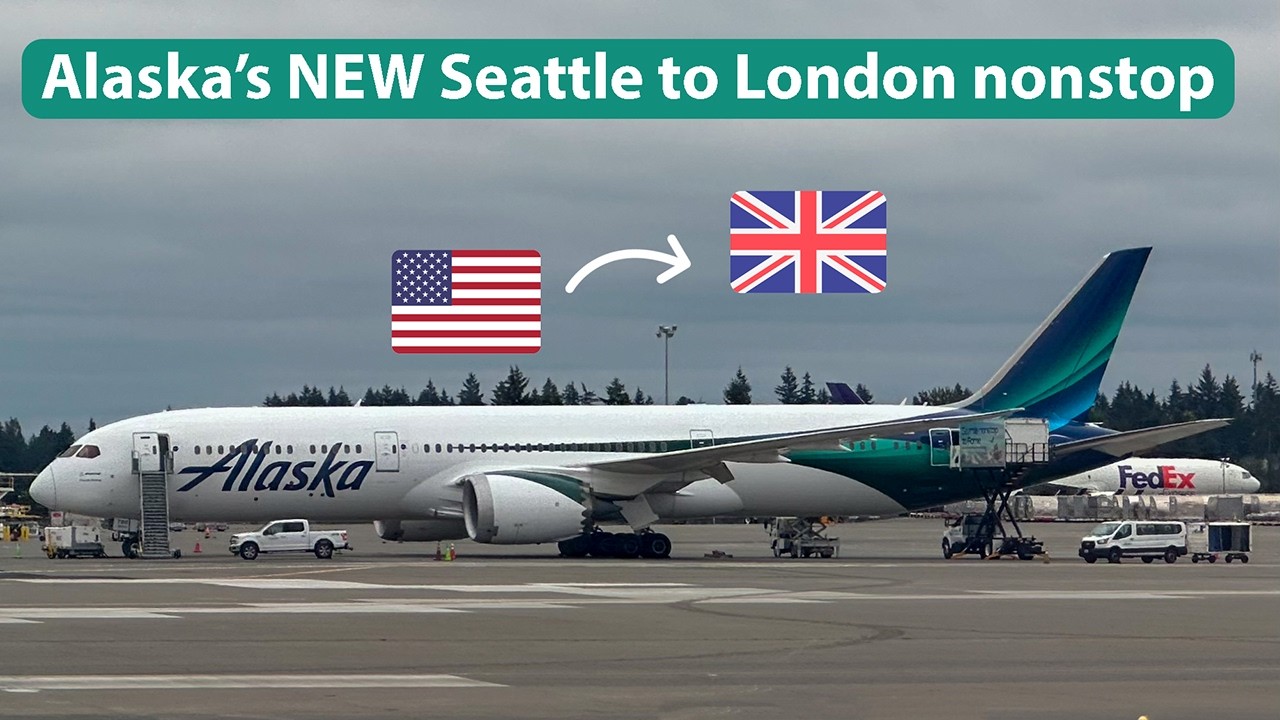
Alaska Airlines Boeing 787-9 Main Cabin Trip Report | Seattle to London
19:50 · Jul 2026

The Points Guy | Departures
Will Alaska + Hawaiian Shake Up U.S. Aviation? 787 Seattle to Seoul Flight Review
17:23 · Dec 2025
Source: YouTube. Titles, thumbnails, and channel names come from YouTube. Playing a video loads the YouTube player, and using it means you agree to the YouTube Terms of Service; the Google Privacy Policy applies.