Carlsbad
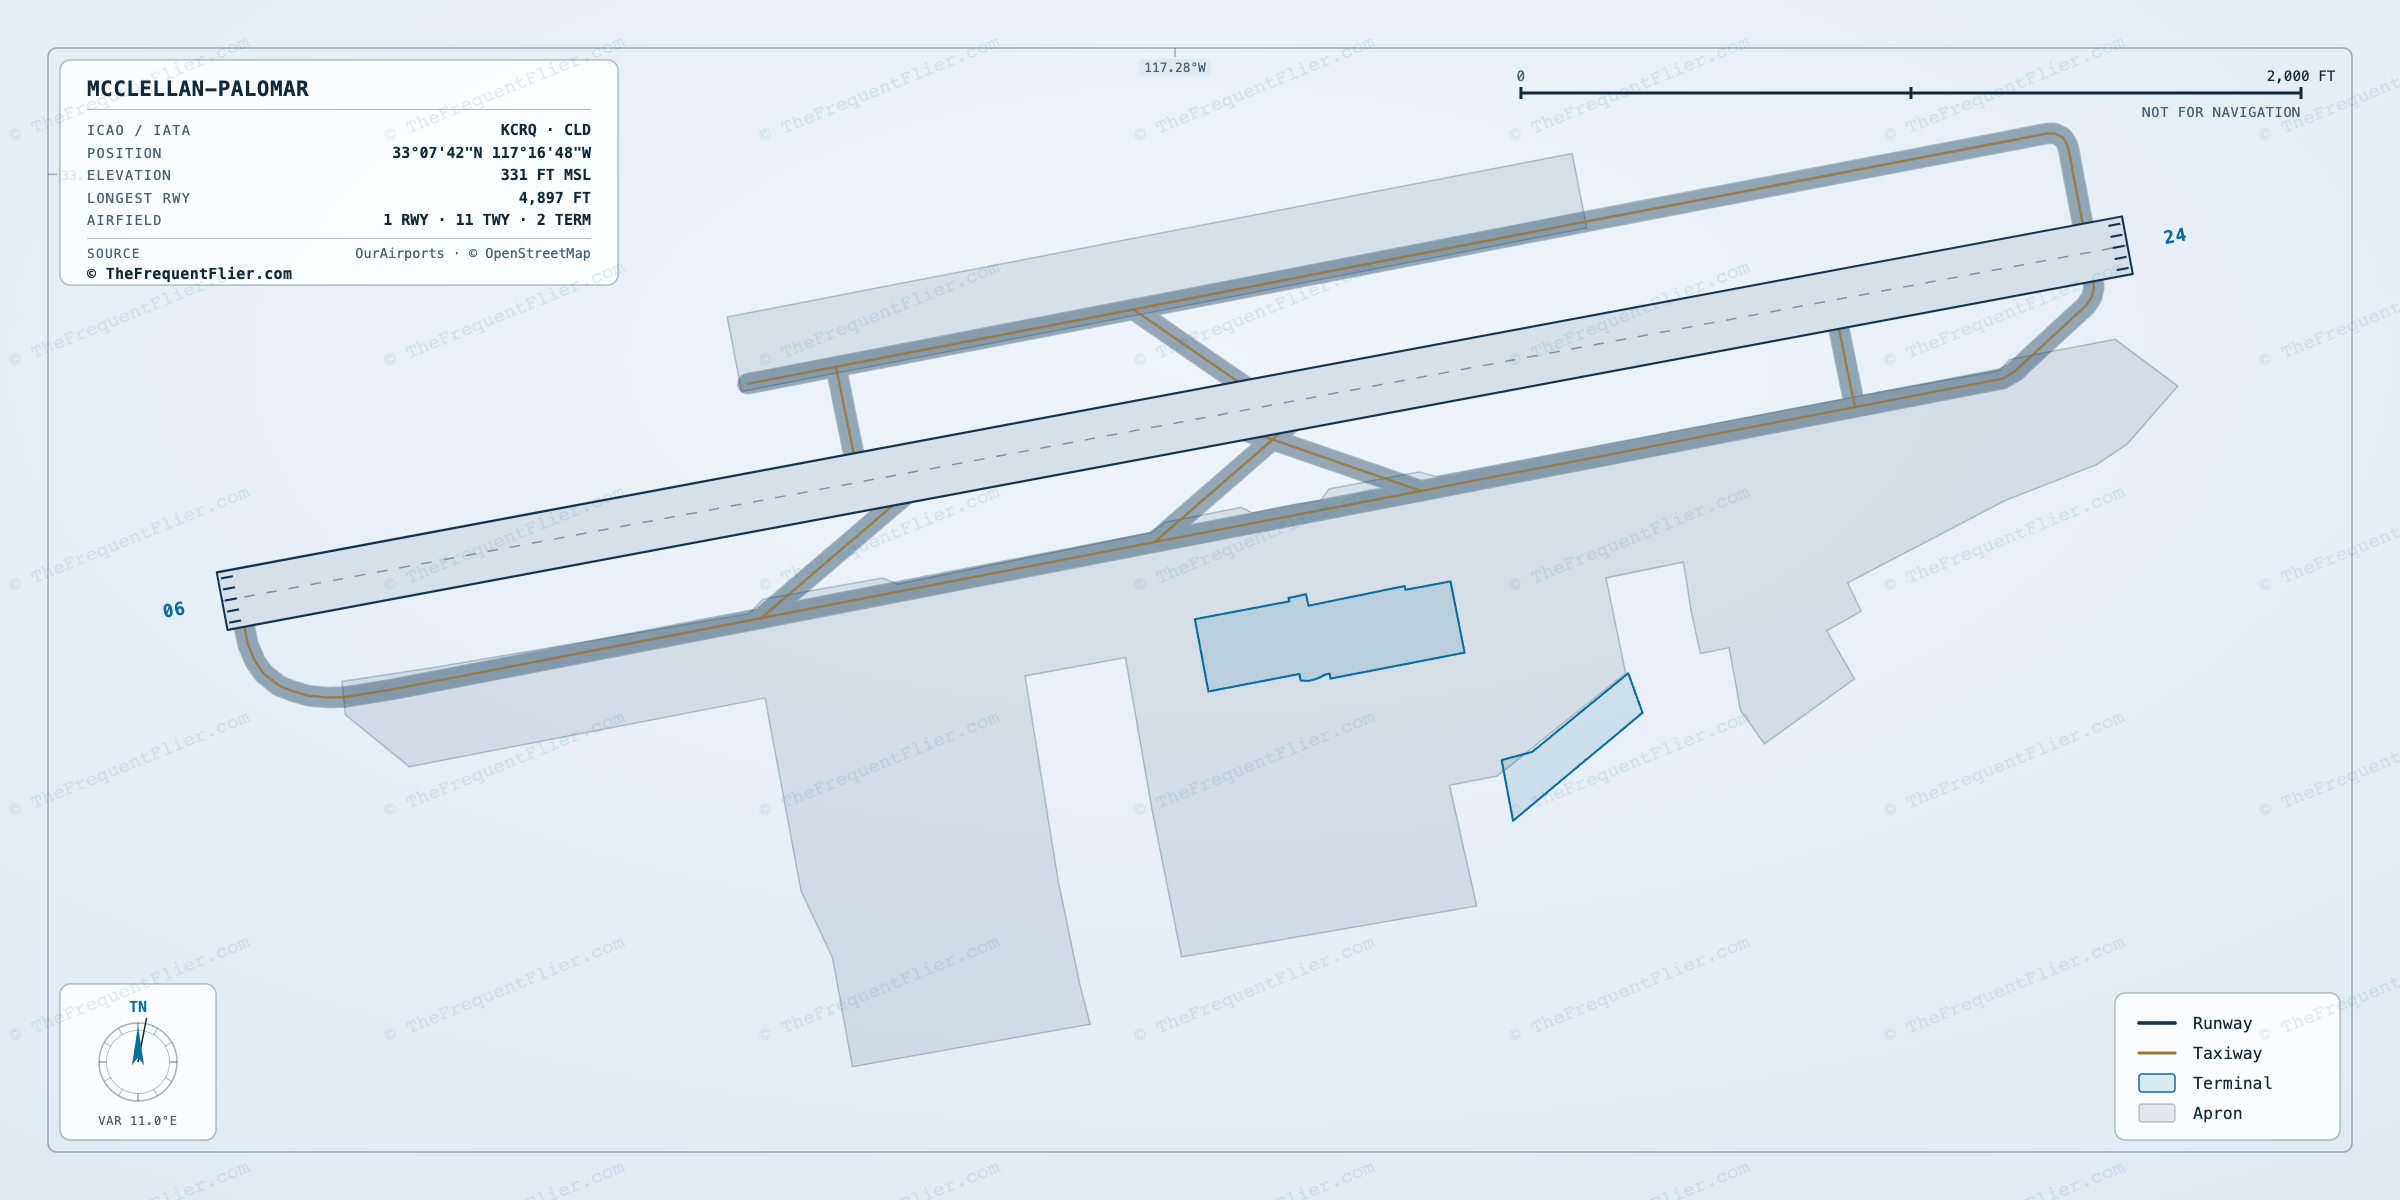
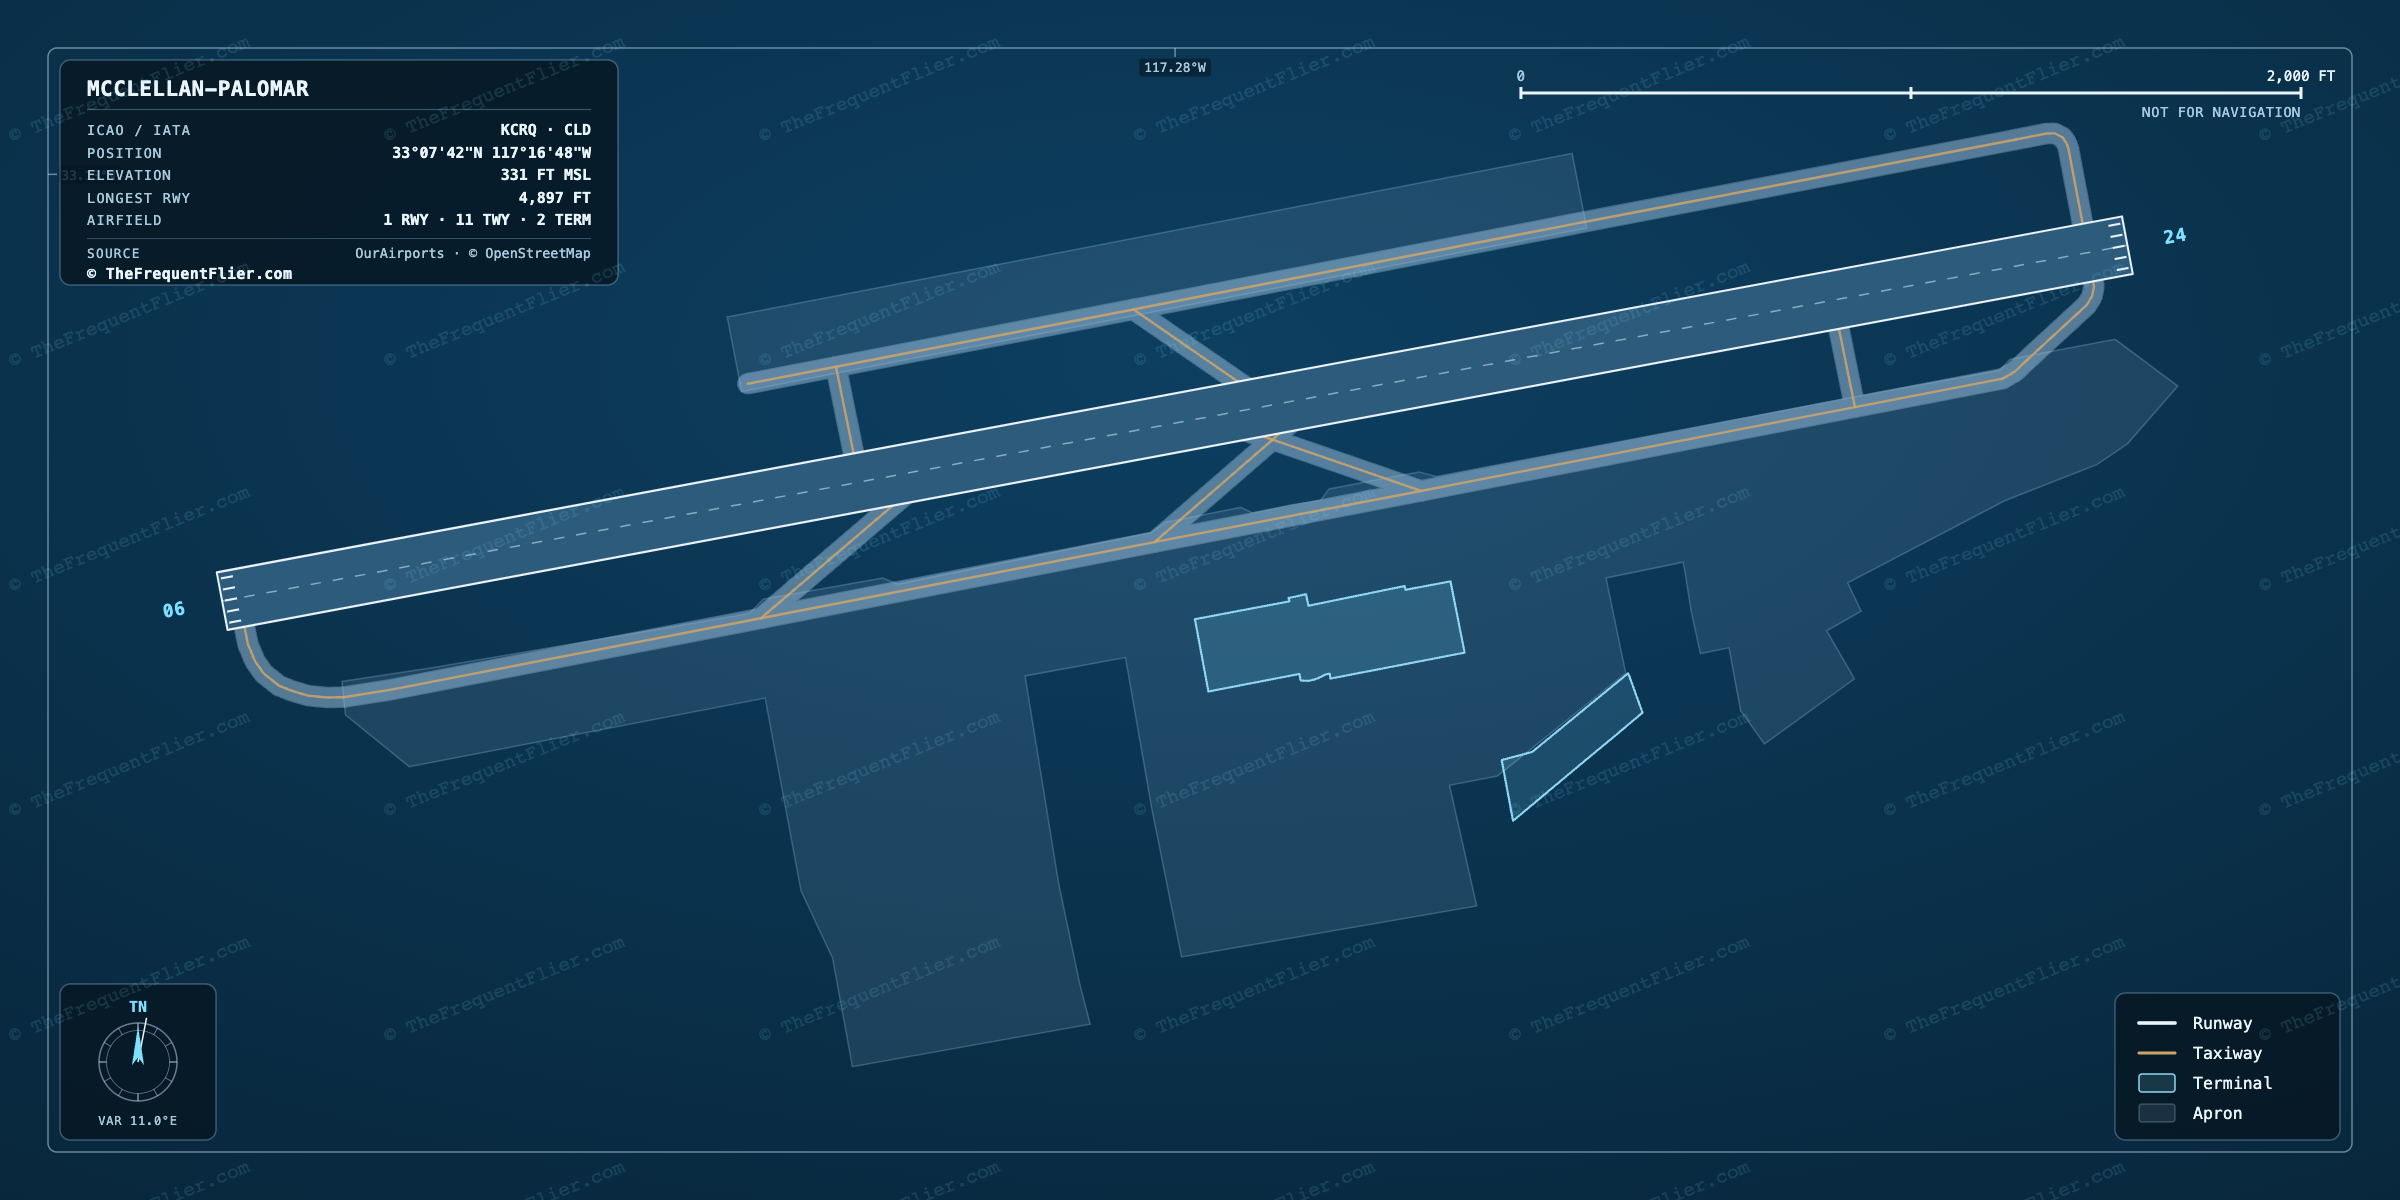
CLD · KCRQMcClellan-Palomar Airport
Passengers a year
208.6K
#214 busiest in the U.S.
5
nonstop destinations
8
airlines
8
departures a day
78.8%
arrivals on time
0.9%
flights cancelled
68.6%
load factor
Airlines
American Airlines is the largest carrier at Carlsbad, with 49% of all passengers. 8 airlines fly from here.
Share of passengers · each carrier as a slice of the whole airport
American Airlines holds 49% of the airport — the 79th most concentrated of 120 non-hub airports. The nearest comparison is OAJ at 50%.
| Airline | Share | Passengers | Seats YoY | |
|---|---|---|---|---|
AA | 49.3% | 102.8K | 1 | +155.2% |
XE JSX68% full | 29.6% | 61.6K | — | +26.4% |
UA | 19.1% | 39.9K | 2 | — |
AN ADVANCED AIR61% full | 1.9% | 4K | 2 | — |
3EQ Silver Air46% full | 0.0% | 97 | — | — |
Share, passengers and destinations count each airline’s own flights plus the regional flying sold under its brand. Seats year on year compares the latest twelve months against the twelve before them.
Destinations
5 nonstop destinations from Carlsbad, all domestic.
100% domestic · 0% international · by departing passengers
All nonstop destinations
5 nonstop · 3 airlines · 5 domestic / 0 intl
Aircraft
By share of departures at Carlsbad.
Body class · share of departures
Embraer ERJ-135
1,460 departures · 68% full
49.3%
- Regional
1,353 departures · 69% full
45.7%
Dornier 328
110 departures · 61% full
3.7%
Beechcraft Super King Air
11 departures · 62% full
0.4%
Cessna Citationjet
7 departures · 31% full
0.2%
Bomardier Challenger 350
4 departures · 52% full
0.1%
Pilatus PC-12
2 departures · 31% full
0.1%
Bombardier BD-100-1A10 Challenger 300
2 departures · 65% full
0.1%
Cessna CE-680 Citation Sovereign
2 departures · 53% full
0.1%
Hawker Siddeley 125
2 departures · 94% full
0.1%
When Carlsbad is busiest
Departures by month over the trailing year. Bars scale to the busiest month.
Aug
Sep
Oct
Nov
Dec
Jan
Feb
Mar
Apr
May
Jun
Jul
Departures a month · peak July 2026
Annual passengers since 1998
Total passengers, arriving and departing, in every year on record.
Passengers a year
Every year
- 1998
- 32,379
- 1999
- 19,983
- 2002
- 25,666
- 2003
- 95,502
- 2004
- 92,691
- 2005
- 85,472
- 2006
- 95,687
- 2007
- 89,534
- 2008
- 66,423
- 2009
- 48,352
- 2010
- 54,313
- 2011
- 89,142
- 2012
- 93,266
- 2013
- 98,668
- 2014
- 97,122
- 2015
- 23,430
- 2016
- 264
- 2017
- 11,717
- 2018
- 9,765
- 2019
- 185
- 2020
- 1,140
- 2021
- 2,154
- 2022
- 6,991
- 2023
- 7,893
- 2024
- 34,267
- 2025
- 136,111
- 2026
- 144,107 so far
Arriving on time
Of every 100 flights landing at Carlsbad, 79 touch down within 15 minutes of schedule, 20 arrive late, and 1 is cancelled.
Every 100 arrivals
15 min
average delay
12
flights cancelled
1.4K
arrivals measured
What holds flights up
Share of delay minutes
Most reliable here
Envoy Air 83.5%
Least reliable here
SkyWest Airlines 70.8%
Among US airports
#214
On time, month by month
A
S
O
N
D
J
F
M
A
M
J
J
Darker is better · 70%–75.9%
The weak spot is June 2026, when 70% of arrivals landed on time — 8.8 points below the year. The strongest was May 2026 at 75.9%.
Frequently asked
How busy is McClellan-Palomar Airport (CLD)?
McClellan-Palomar Airport handled about 208.6K passengers over the trailing 12 months, ranking #214 among U.S. airports by passengers, with roughly 8 departures a day.
Which airline is the largest at McClellan-Palomar Airport (CLD)?
American Airlines is the largest carrier at Carlsbad (CLD), flying about 49% of its passengers. 8 airlines serve Carlsbad in total.
How many places can you fly nonstop from McClellan-Palomar Airport (CLD)?
Carlsbad (CLD) has 5 nonstop destinations, all domestic.
How often do flights arrive on time at McClellan-Palomar Airport (CLD)?
About 78.8% of flights arriving at Carlsbad (CLD) touch down within 15 minutes of schedule, per US DOT figures. About 0.9% are cancelled.
What aircraft flies most from McClellan-Palomar Airport (CLD)?
The Embraer ERJ-135 flew the largest share of departures from Carlsbad (CLD), about 49% of the total.
Departing counts passengers leaving Carlsbad. Data: traffic August 2025 – July 2026, on-time August 2025 – July 2026. Source: US DOT Bureau of Transportation Statistics (T-100 Segment, On-Time Performance).