Sitka
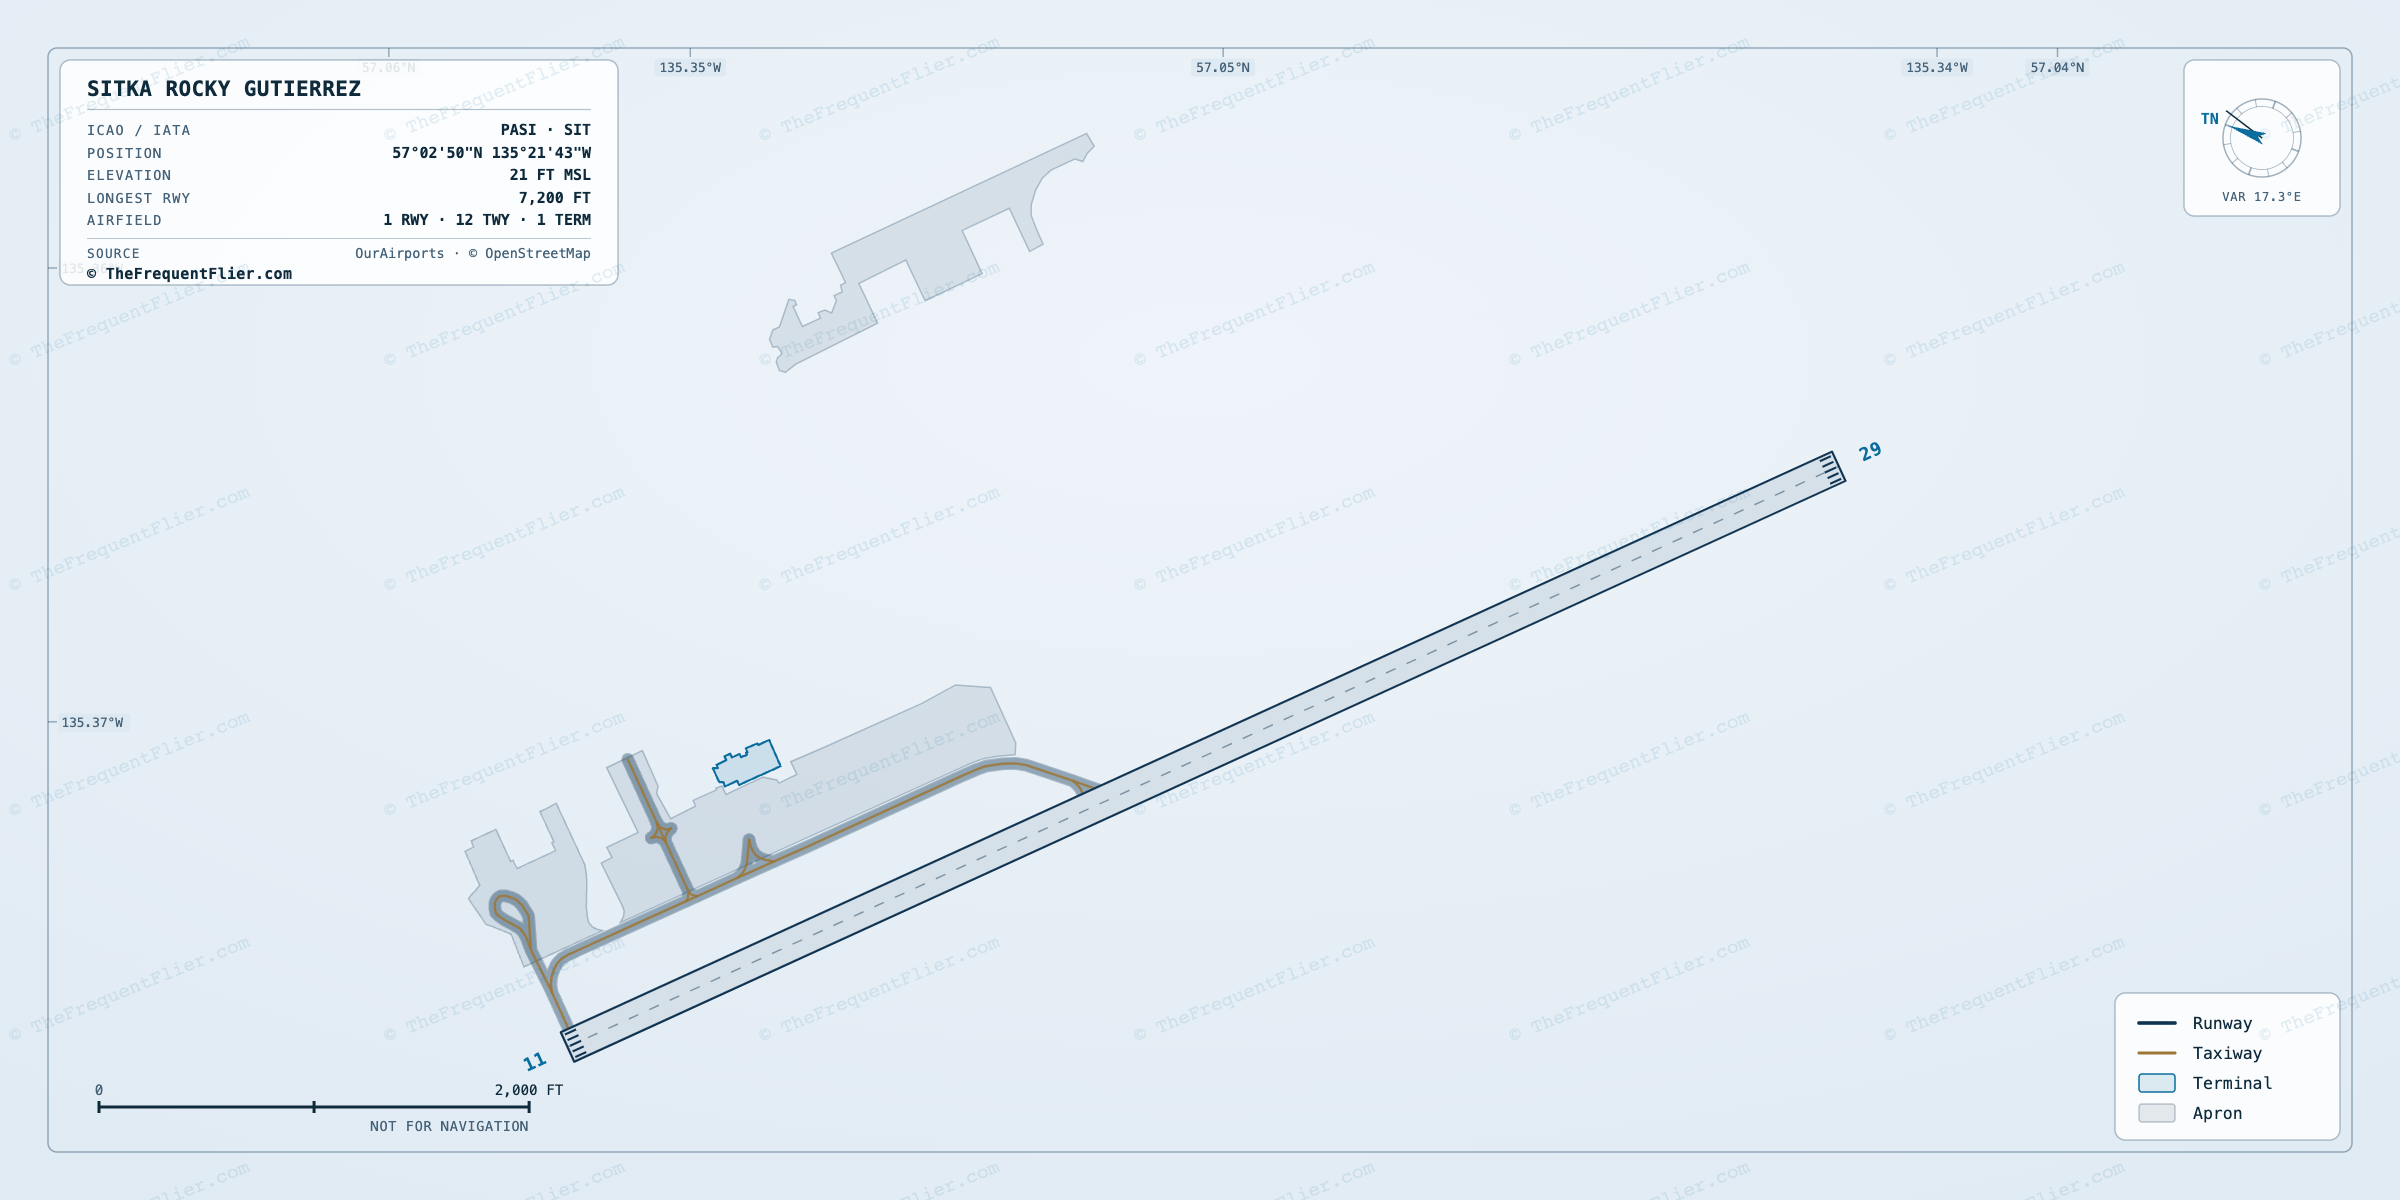
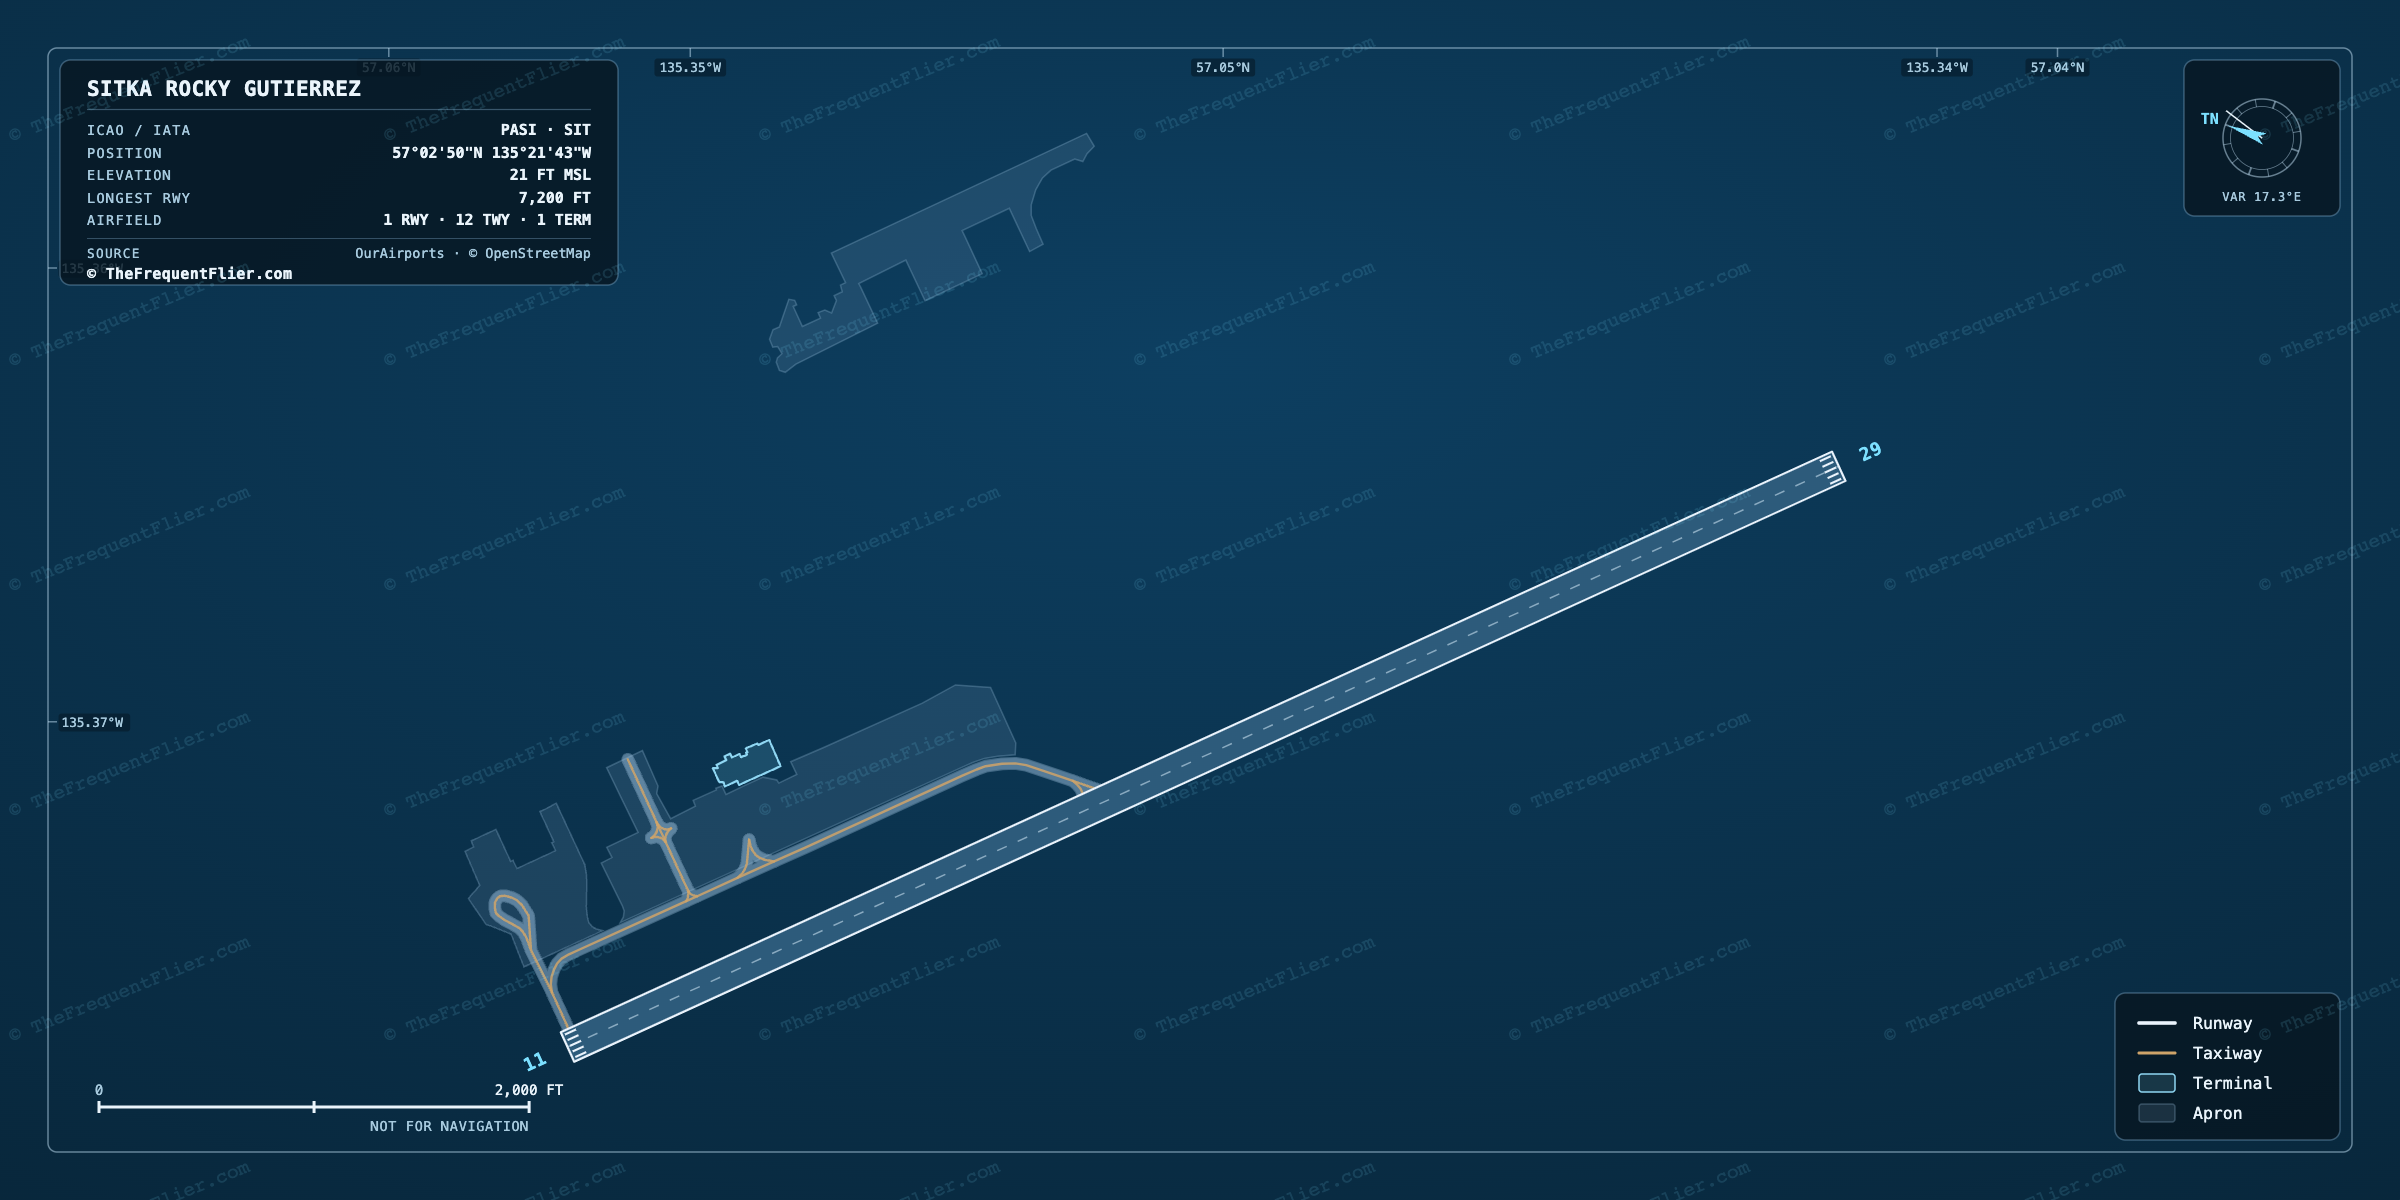
SIT · PASISitka Rocky Gutierrez Airport
Passengers a year
239.8K
#209 busiest in the U.S.
6
nonstop destinations
4
airlines
7
departures a day
79.1%
arrivals on time
2.4%
flights cancelled
66.0%
load factor
Airlines
Alaska Airlines is the largest carrier at Sitka, with 96% of all passengers. 4 airlines fly from here.
Share of passengers · each carrier as a slice of the whole airport
Alaska Airlines holds 96% of the airport — the 6th most concentrated of 120 non-hub airports. The nearest comparison is SOV at 97%.
| Airline | Share | Passengers | Seats YoY | ||
|---|---|---|---|---|---|
AS Alaska66% full | 96.4% | 231K | 3 | 79.1% | -5.8% |
J5 Alaska Seaplanes44% full | 2.5% | 6K | 3 | — | — |
I4 Island Air Express45% full | 1.0% | 2.4K | 1 | — | — |
BAS Baranautica Air Service45% full | 0.1% | 252 | 1 | — | — |
Share, passengers and destinations count each airline’s own flights plus the regional flying sold under its brand. On-time covers the airline's own aircraft only — regional affiliates report to the government separately. Seats year on year compares the latest twelve months against the twelve before them.
Destinations
6 nonstop destinations from Sitka, all domestic.
100% domestic · 0% international · by departing passengers
Top domestic destinations
All nonstop destinations
6 nonstop · 4 airlines · 6 domestic / 0 intl
Aircraft
By share of departures at Sitka.
Body class · share of departures
- Narrowbody
751 departures · 62% full
30.8%
Pilatus PC-12
723 departures · 45% full
29.6%
Cessna C208B
311 departures · 42% full
12.8%
- Narrowbody
189 departures · 60% full
7.8%
- Narrowbody
184 departures · 69% full
7.5%
- Narrowbody
164 departures · 72% full
6.7%
Cessna 185A
91 departures · 45% full
3.7%
- Narrowbody
20 departures · 79% full
0.8%
Cessna 208 Caravan
4 departures · 7% full
0.2%
Cessna C206
2 departures · 0% full
0.1%
When Sitka is busiest
Departures by month over the trailing year. Bars scale to the busiest month.
Aug
Sep
Oct
Nov
Dec
Jan
Feb
Mar
Apr
May
Jun
Jul
Departures a month · peak August 2025
Annual passengers since 1990
Total passengers, arriving and departing, in every year on record.
Passengers a year
Every year
- 1990
- 226,405
- 1991
- 229,022
- 1992
- 249,314
- 1993
- 221,604
- 1994
- 218,916
- 1995
- 224,607
- 1996
- 220,648
- 1997
- 232,958
- 1998
- 221,066
- 1999
- 220,851
- 2000
- 225,951
- 2001
- 231,121
- 2002
- 231,697
- 2003
- 221,940
- 2004
- 235,412
- 2005
- 227,960
- 2006
- 226,826
- 2007
- 235,078
- 2008
- 223,454
- 2009
- 209,831
- 2010
- 211,576
- 2011
- 212,004
- 2012
- 217,000
- 2013
- 216,996
- 2014
- 227,067
- 2015
- 234,927
- 2016
- 243,923
- 2017
- 260,554
- 2018
- 255,726
- 2019
- 256,599
- 2020
- 92,612
- 2021
- 194,764
- 2022
- 246,386
- 2023
- 254,213
- 2024
- 259,386
- 2025
- 247,899
- 2026
- 142,318 so far
Arriving on time
Of every 100 flights landing at Sitka, 79 touch down within 15 minutes of schedule, 19 arrive late, and 2 are cancelled.
Every 100 arrivals
13 min
average delay
32
flights cancelled
1.3K
arrivals measured
What holds flights up
Share of delay minutes
Among US airports
#209
Frequently asked
How busy is Sitka Rocky Gutierrez Airport (SIT)?
Sitka Rocky Gutierrez Airport handled about 239.8K passengers over the trailing 12 months, ranking #209 among U.S. airports by passengers, with roughly 7 departures a day.
Which airline is the largest at Sitka Rocky Gutierrez Airport (SIT)?
Alaska Airlines is the largest carrier at Sitka (SIT), flying about 96% of its passengers. 4 airlines serve Sitka in total.
How many places can you fly nonstop from Sitka Rocky Gutierrez Airport (SIT)?
Sitka (SIT) has 6 nonstop destinations, all domestic.
How often do flights arrive on time at Sitka Rocky Gutierrez Airport (SIT)?
About 79.1% of flights arriving at Sitka (SIT) touch down within 15 minutes of schedule, per US DOT figures. About 2.4% are cancelled.
What aircraft flies most from Sitka Rocky Gutierrez Airport (SIT)?
The Boeing 737-700 flew the largest share of departures from Sitka (SIT), about 31% of the total.
Departing counts passengers leaving Sitka. Data: traffic August 2025 – July 2026, on-time August 2025 – July 2026. Source: US DOT Bureau of Transportation Statistics (T-100 Segment, On-Time Performance).