Eagle
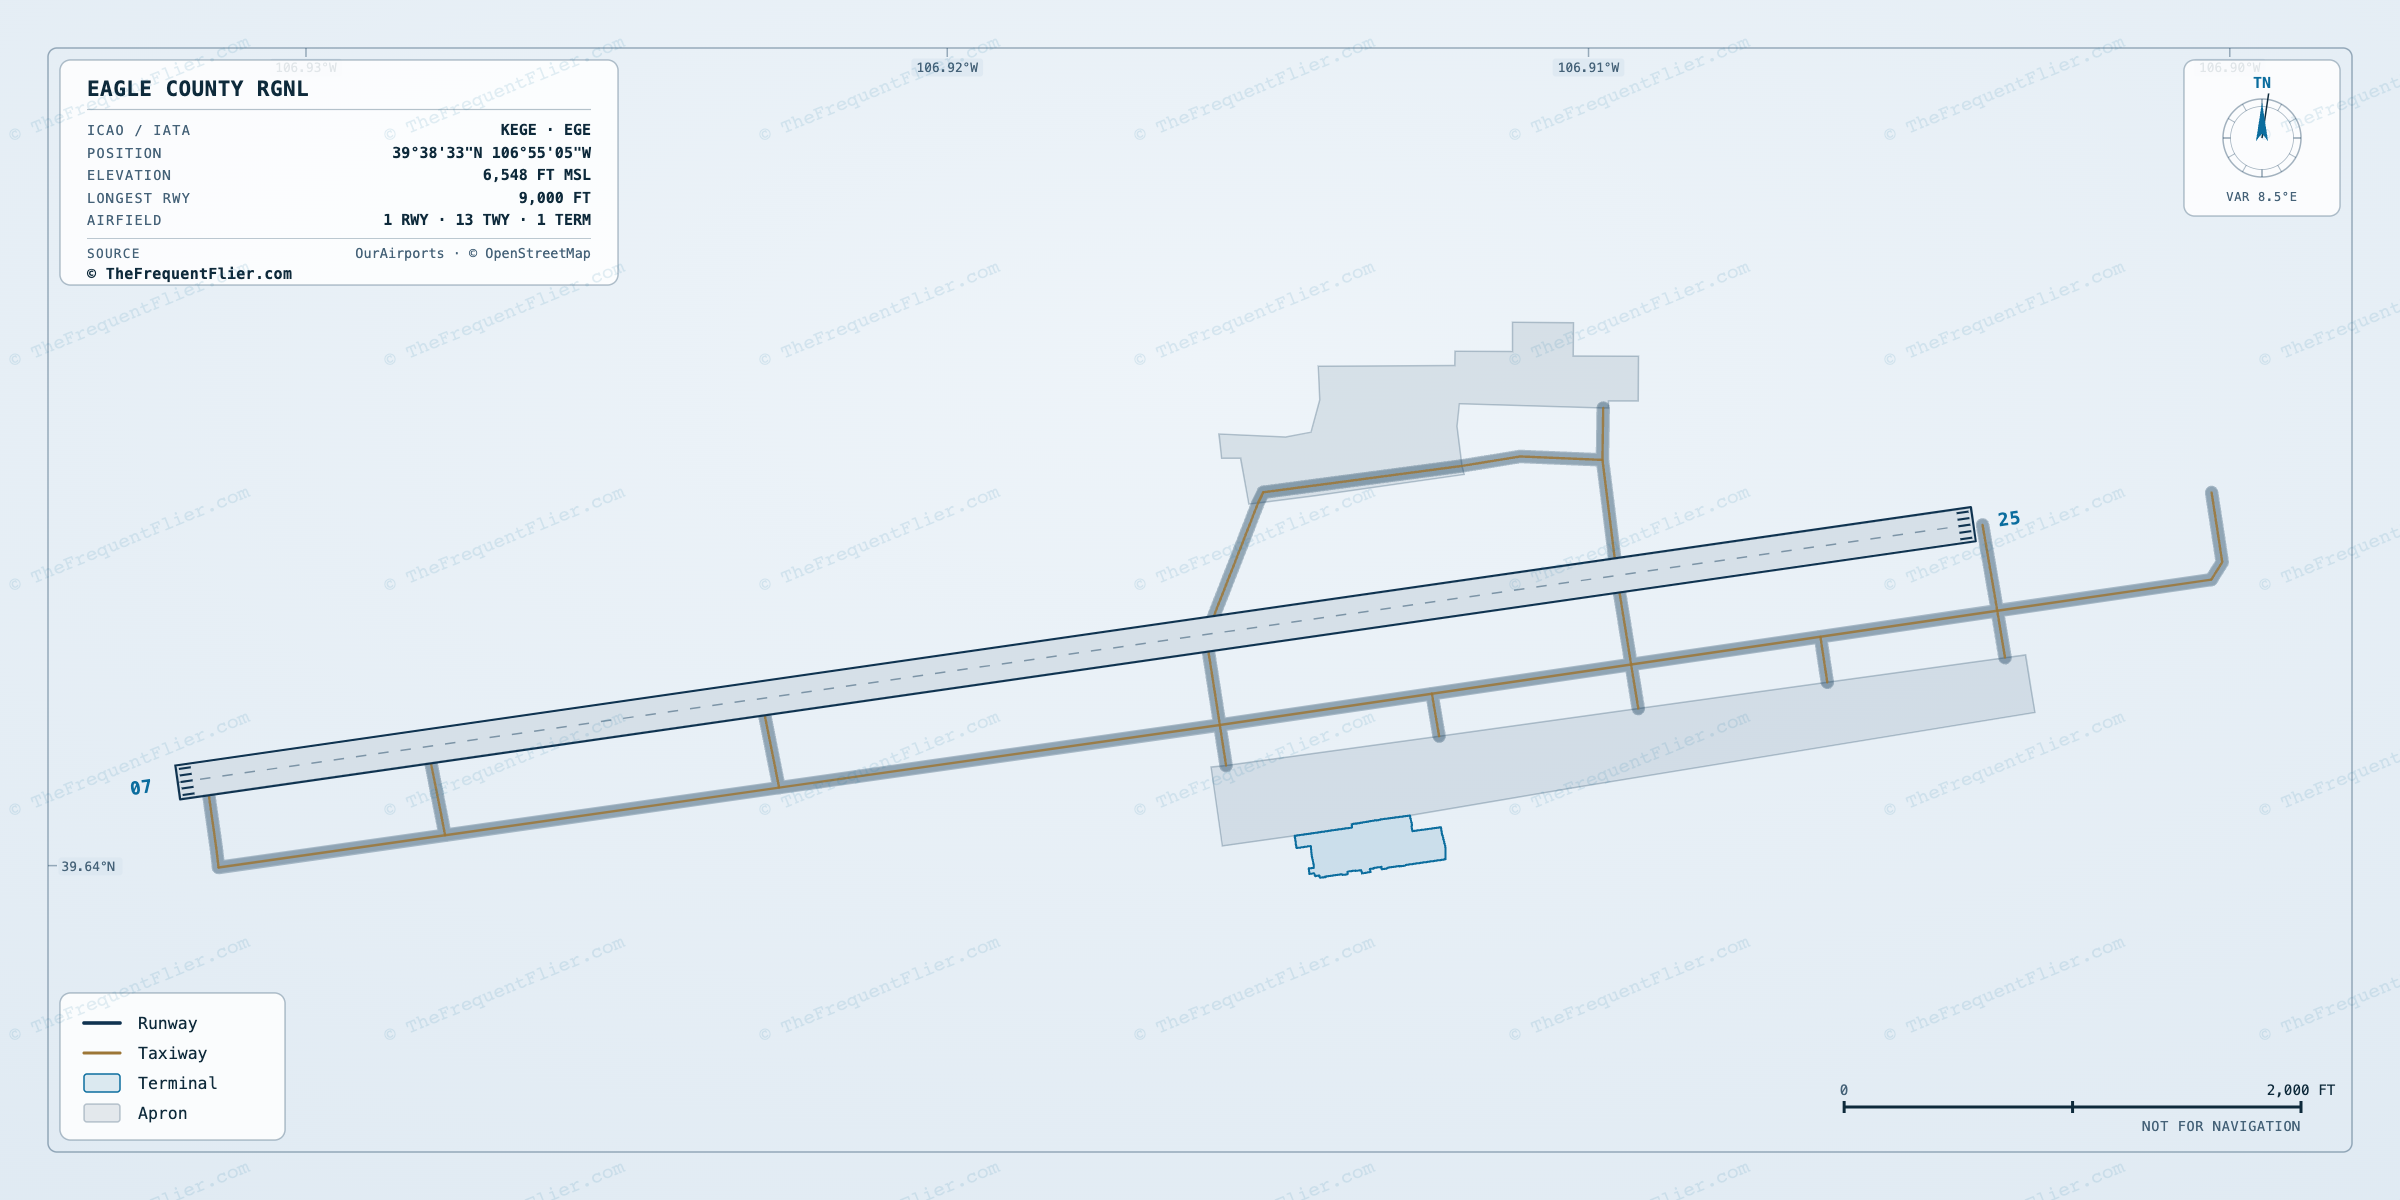
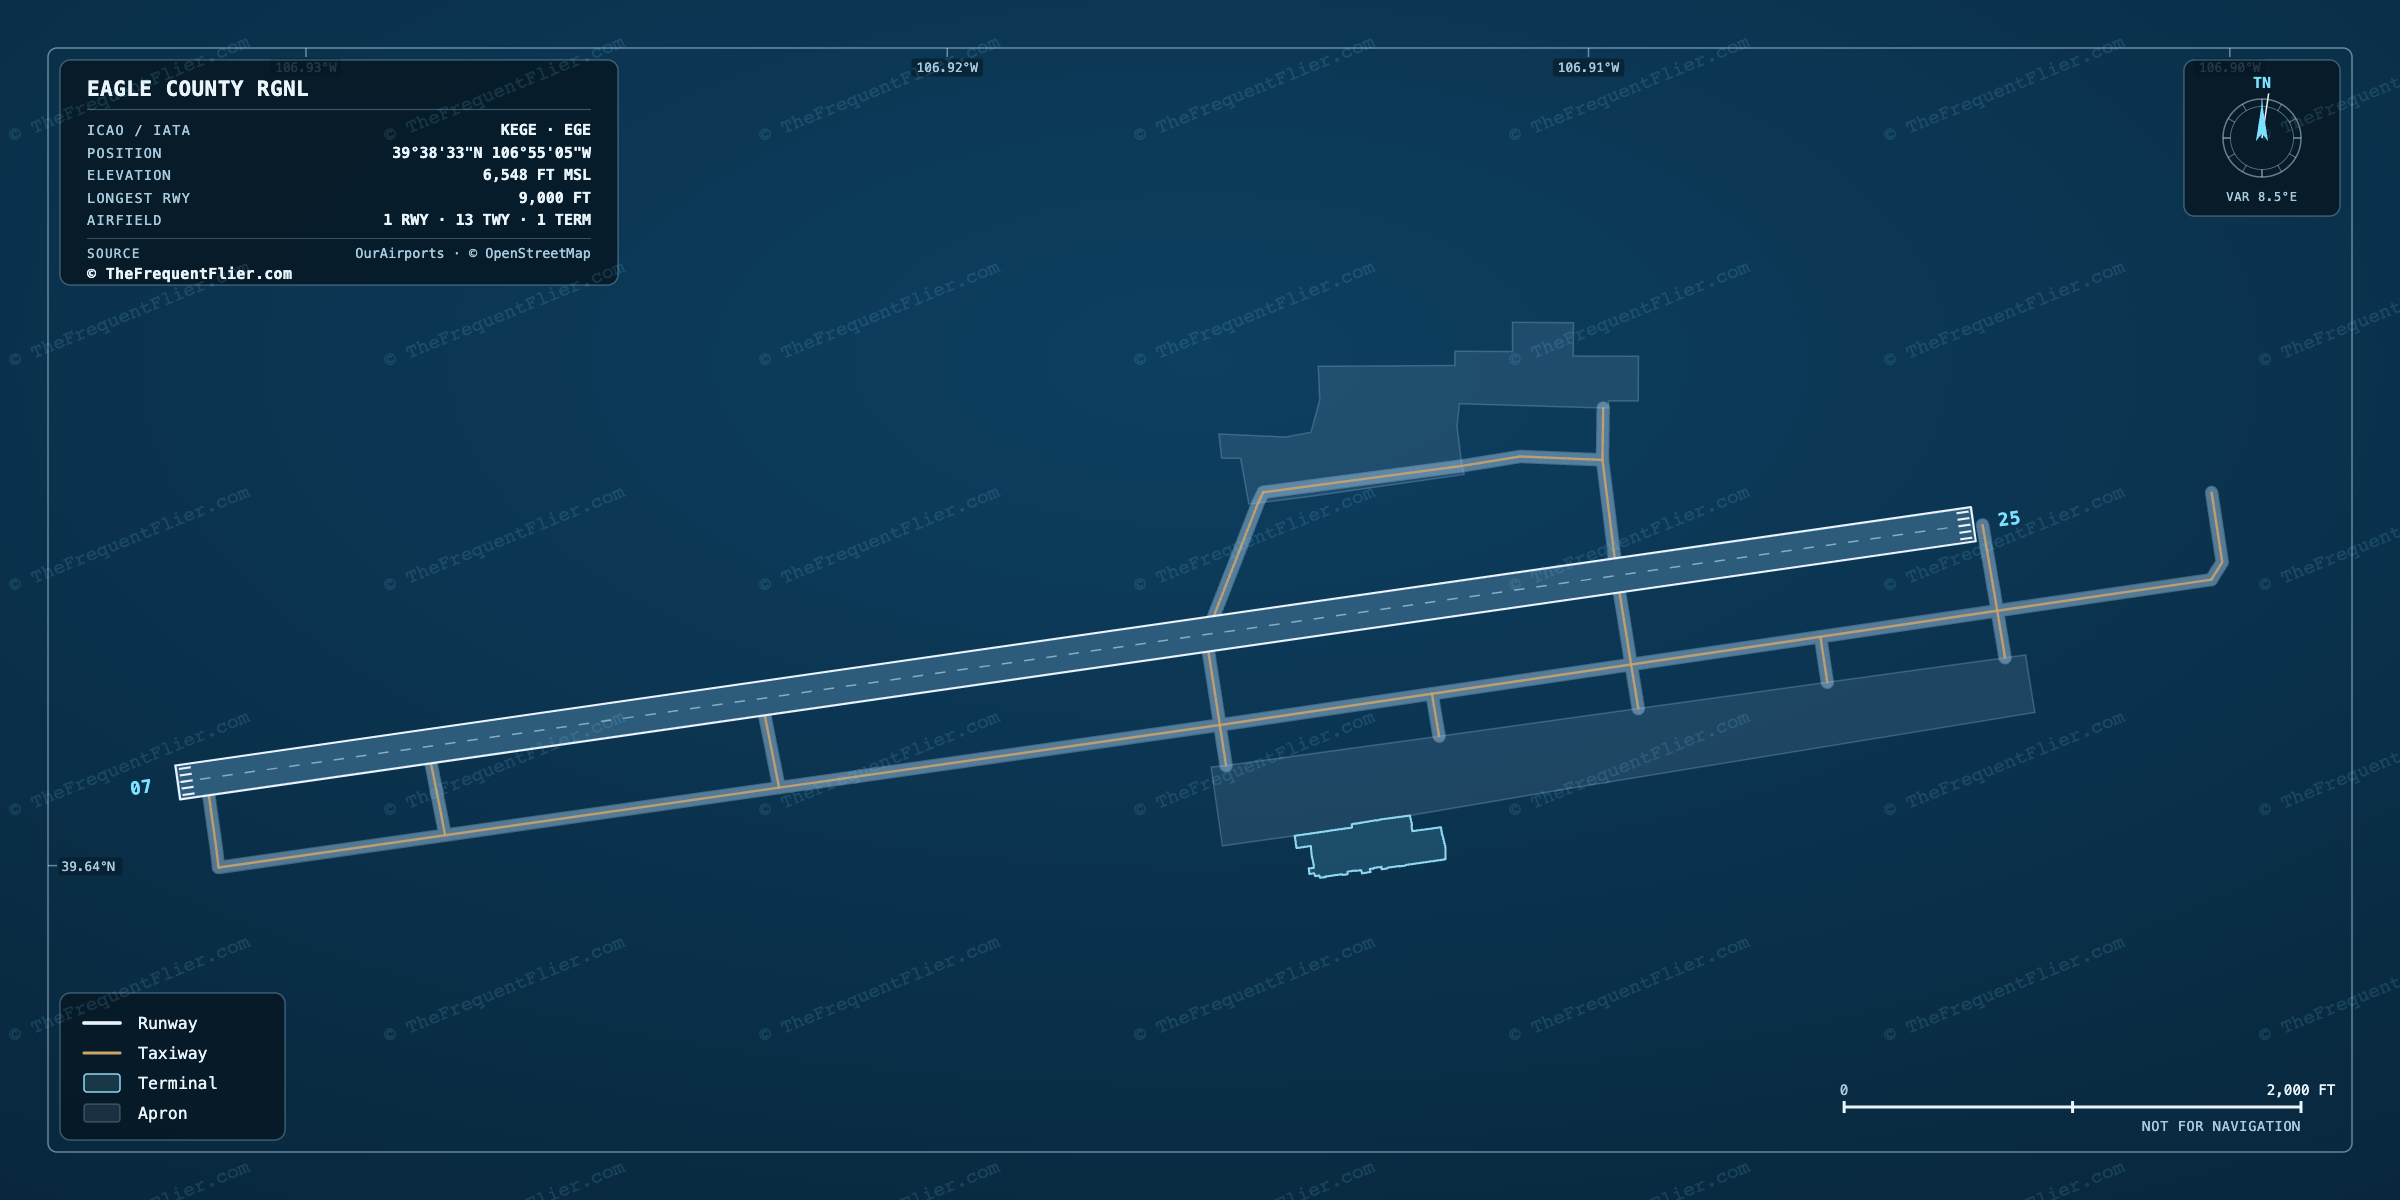
EGE · KEGEEagle County Regional Airport
Passengers a year
661.7K
#169 busiest in the U.S.
16
nonstop destinations
14
airlines
11
departures a day
70.4%
arrivals on time
1.6%
flights cancelled
68.0%
load factor
Airlines
United Airlines is the largest carrier at Eagle, with 50% of all passengers. 14 airlines fly from here.
Share of passengers · each carrier as a slice of the whole airport
United Airlines holds 50% of the airport — the 74th most concentrated of 120 non-hub airports. The nearest comparison is GRB at 51%.
| Airline | Share | Passengers | Seats YoY | ||
|---|---|---|---|---|---|
UA | 50.3% | 332.8K | 7 | 74.3% | +58.5% |
AA | 40.0% | 264.6K | 7 | 63.4% | -3.5% |
DL | 8.8% | 58.4K | 4 | — | -9.3% |
AS | 0.9% | 5.7K | 2 | — | -45.8% |
LF Contour Airlines23% full | 0.0% | 67 | — | — | — |
Share, passengers and destinations count each airline’s own flights plus the regional flying sold under its brand. On-time covers the airline's own aircraft only — regional affiliates report to the government separately. Seats year on year compares the latest twelve months against the twelve before them.
Destinations
16 nonstop destinations from Eagle, all domestic.
100% domestic · 0% international · by departing passengers
Top domestic destinations
United Airlines
85.5K85,471 departing · 78% full
American Airlines
United Airlines · American Airlines
Delta Air Lines
United Airlines
American Airlines
United Airlines
American Airlines · Delta Air Lines
9.2K9,205 departing · 51% full
Delta Air Lines · United Airlines · American Airlines
American Airlines
All nonstop destinations
16 nonstop · 4 airlines · 16 domestic / 0 intl
American Eagle · operated by SkyWest Airlines
Delta Connection · operated by SkyWest Airlines
United Express · operated by SkyWest Airlines
Aircraft
By share of departures at Eagle.
Body class · share of departures
- Narrowbody
1,316 departures · 74% full
33.6%
- Narrowbody
912 departures · 62% full
23.3%
- Regional
656 departures · 49% full
16.8%
- Narrowbody
452 departures · 66% full
11.6%
- Narrowbody
303 departures · 66% full
7.7%
- Regional
243 departures · 54% full
6.2%
- Narrowbody
8 departures · 63% full
0.2%
Embraer ERJ-135
5 departures · 24% full
0.1%
Bombardier BD-100-1A10 Challenger 300
3 departures · 68% full
0.1%
Beechcraft Super King Air
1 departures · 44% full
0.0%
When Eagle is busiest
Departures by month over the trailing year. Bars scale to the busiest month.
Aug
Sep
Oct
Nov
Dec
Jan
Feb
Mar
Apr
May
Jun
Jul
Departures a month · peak March 2026
Annual passengers since 1990
Total passengers, arriving and departing, in every year on record.
Passengers a year
Every year
- 1990
- 18,112
- 1991
- 60,206
- 1992
- 71,593
- 1993
- 109,980
- 1994
- 129,716
- 1995
- 165,351
- 1996
- 232,033
- 1997
- 336,288
- 1998
- 339,017
- 1999
- 324,432
- 2000
- 333,854
- 2001
- 337,937
- 2002
- 341,328
- 2003
- 339,370
- 2004
- 388,373
- 2005
- 426,191
- 2006
- 434,732
- 2007
- 460,534
- 2008
- 423,087
- 2009
- 363,554
- 2010
- 404,074
- 2011
- 379,147
- 2012
- 336,131
- 2013
- 329,685
- 2014
- 325,521
- 2015
- 317,439
- 2016
- 330,939
- 2017
- 310,452
- 2018
- 347,648
- 2019
- 380,523
- 2020
- 283,223
- 2021
- 403,766
- 2022
- 431,652
- 2023
- 454,083
- 2024
- 563,819
- 2025
- 644,842
- 2026
- 472,671 so far
Arriving on time
Of every 100 flights landing at Eagle, 70 touch down within 15 minutes of schedule, 28 arrive late, and 2 are cancelled.
Every 100 arrivals
23 min
average delay
63
flights cancelled
3.9K
arrivals measured
What holds flights up
Share of delay minutes
Most reliable here
United Airlines 74.3%
Least reliable here
American Airlines 63.4%
Among US airports
#169
On time, month by month
A
S
O
N
D
J
F
M
A
M
J
J
Darker is better · 55.3%–78.7%
The weak spot is December 2025, when 55.3% of arrivals landed on time — 15.1 points below the year. The strongest was April 2026 at 78.7%.
Frequently asked
How busy is Eagle County Regional Airport (EGE)?
Eagle County Regional Airport handled about 661.7K passengers over the trailing 12 months, ranking #169 among U.S. airports by passengers, with roughly 11 departures a day.
Which airline is the largest at Eagle County Regional Airport (EGE)?
United Airlines is the largest carrier at Eagle (EGE), flying about 50% of its passengers. 14 airlines serve Eagle in total.
How many places can you fly nonstop from Eagle County Regional Airport (EGE)?
Eagle (EGE) has 16 nonstop destinations, all domestic.
How often do flights arrive on time at Eagle County Regional Airport (EGE)?
About 70.4% of flights arriving at Eagle (EGE) touch down within 15 minutes of schedule, per US DOT figures. About 1.6% are cancelled.
What aircraft flies most from Eagle County Regional Airport (EGE)?
The Airbus A319 flew the largest share of departures from Eagle (EGE), about 34% of the total.
Departing counts passengers leaving Eagle. Data: traffic August 2025 – July 2026, on-time August 2025 – July 2026. Source: US DOT Bureau of Transportation Statistics (T-100 Segment, On-Time Performance).