Deadhorse
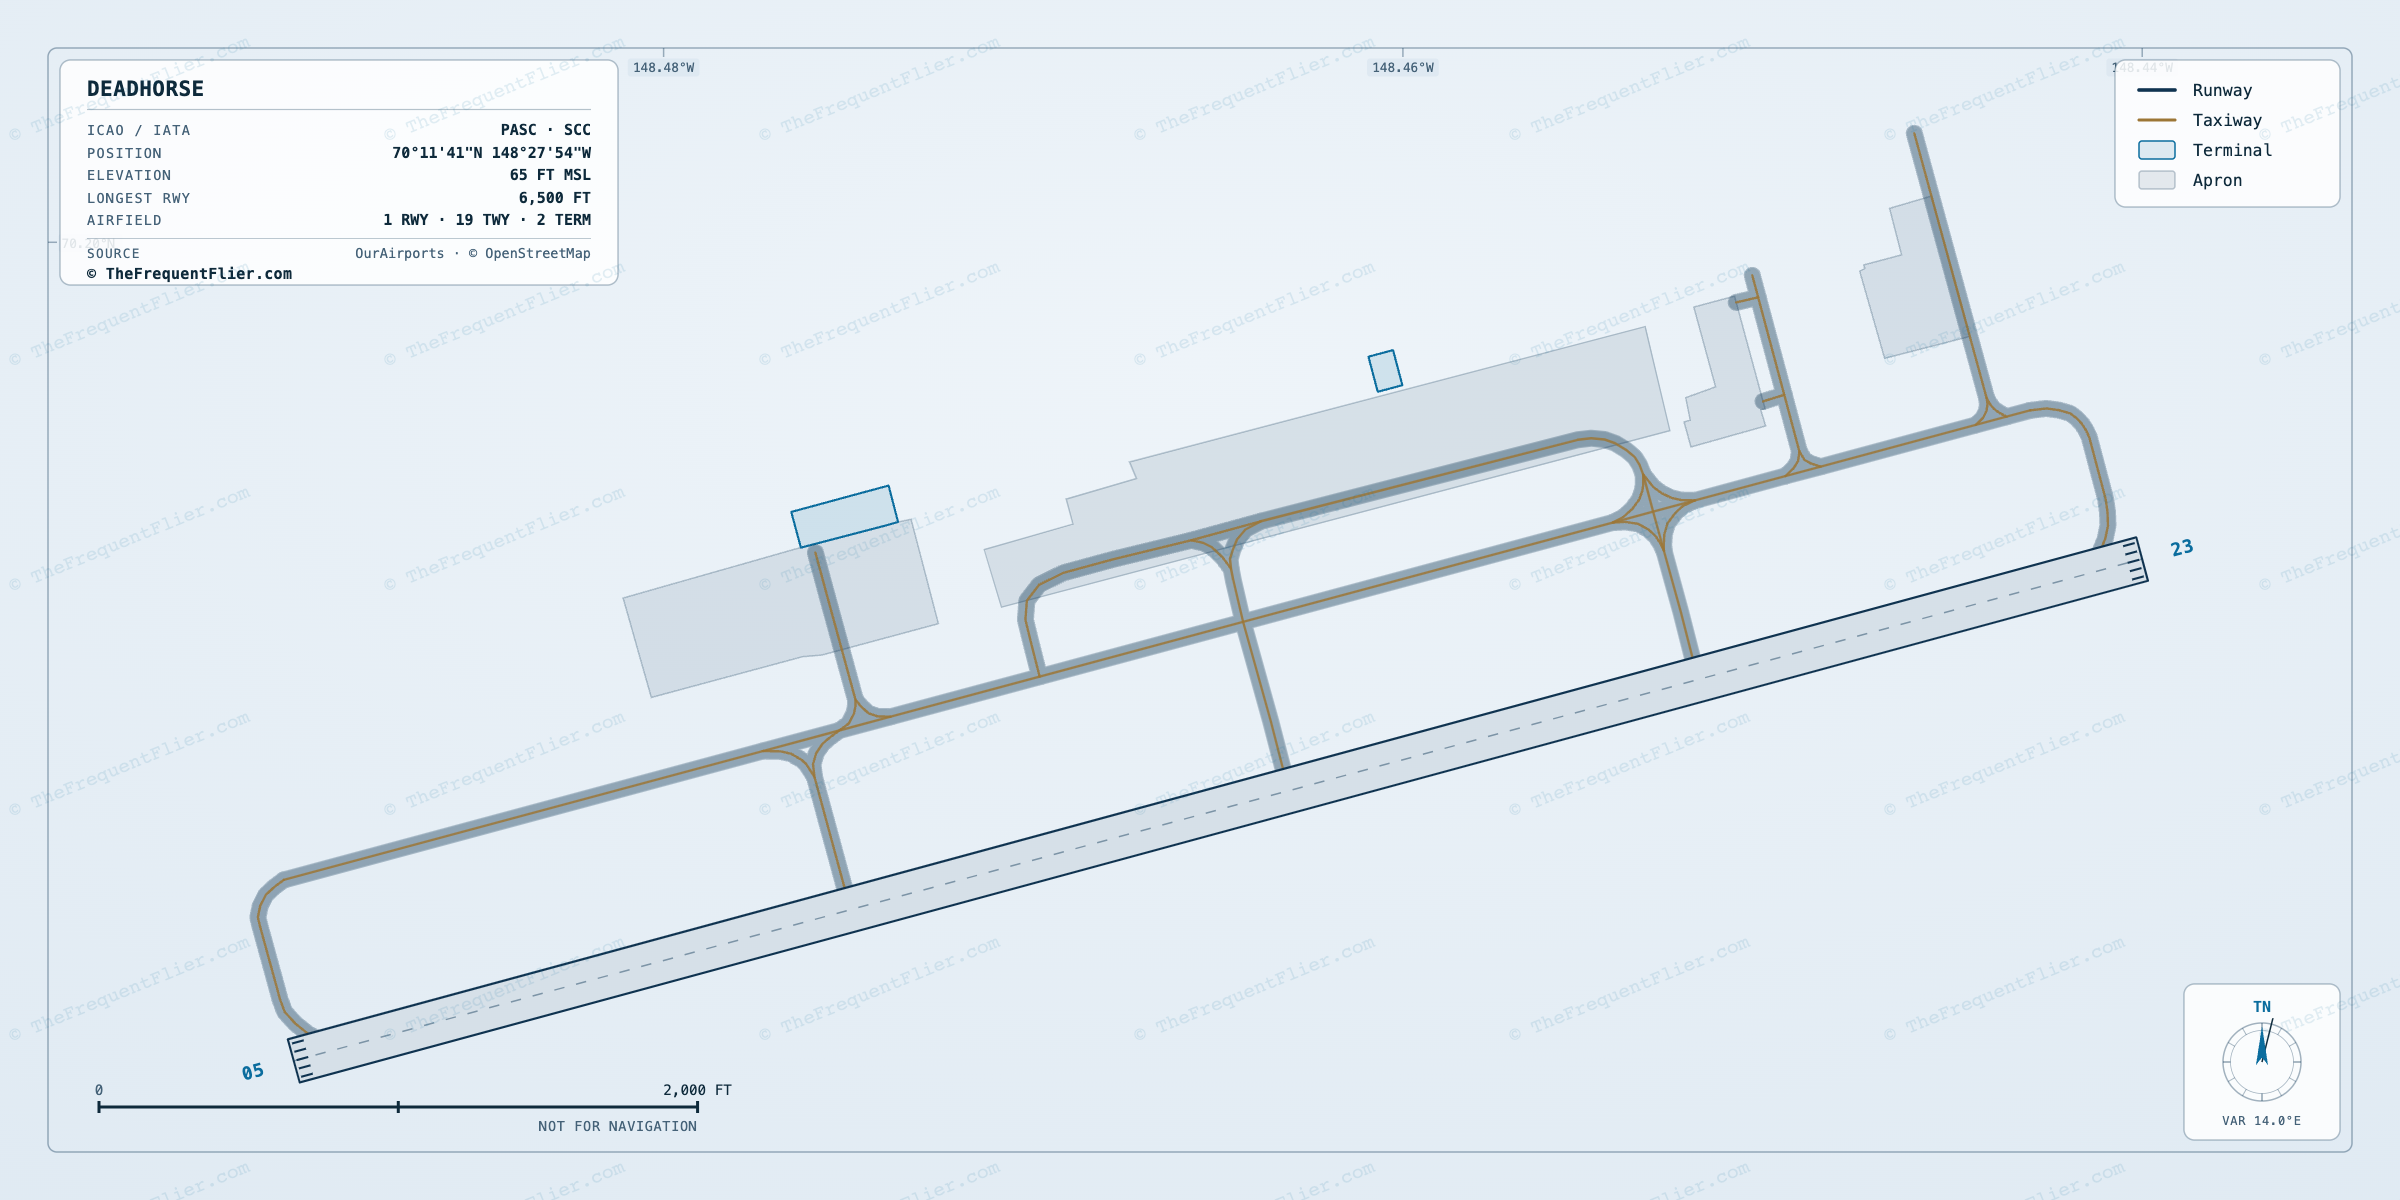
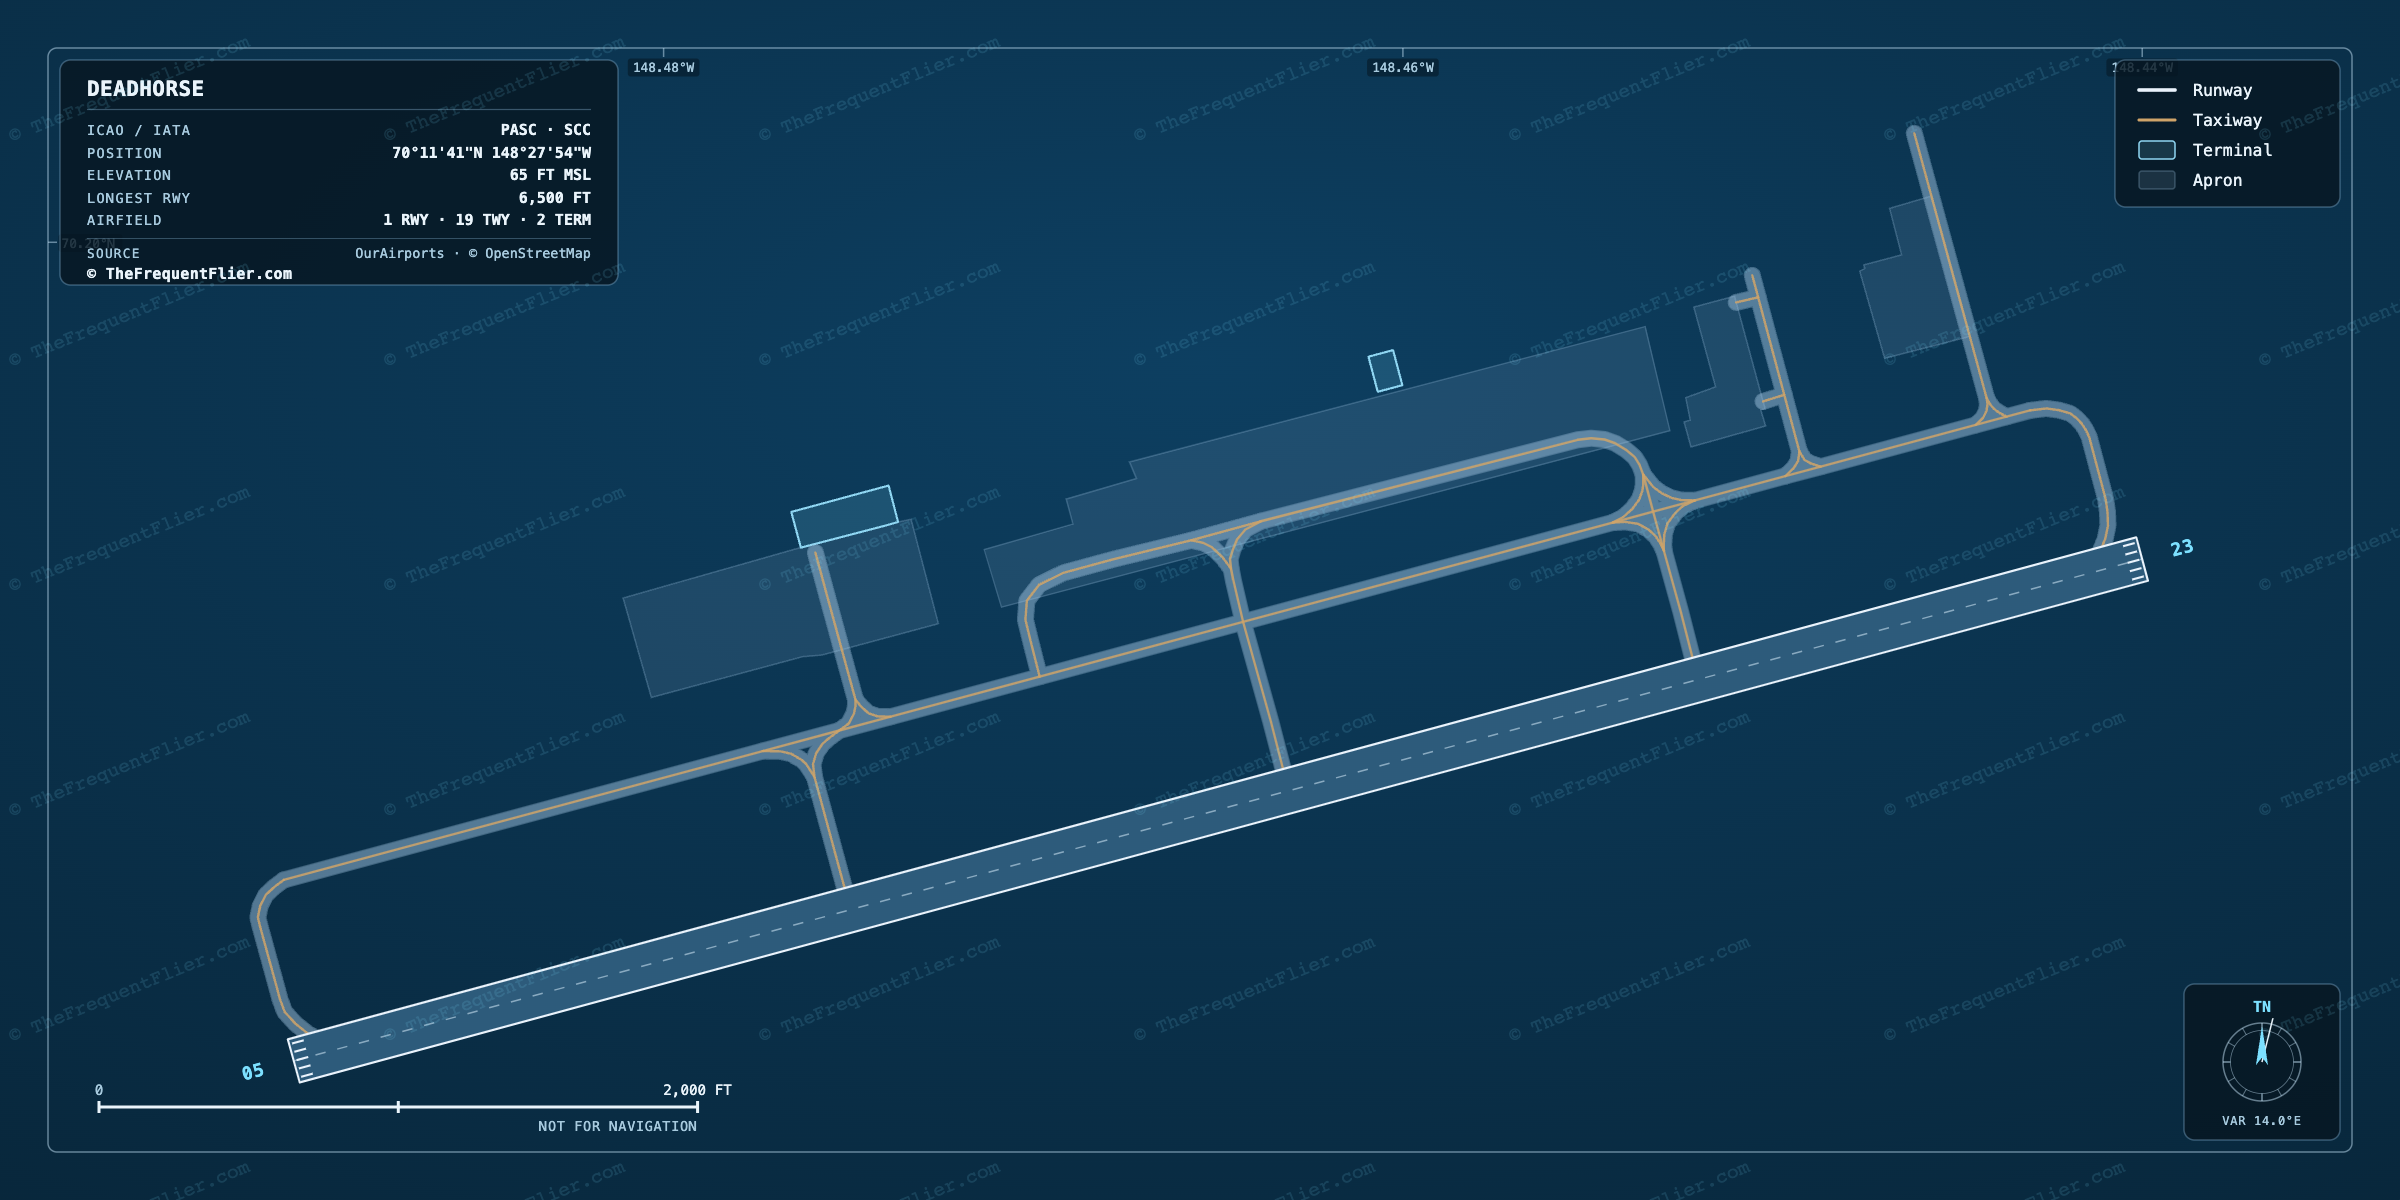
SCC · PASCDeadhorse Airport
Passengers a year
204K
#216 busiest in the U.S.
7
nonstop destinations
9
airlines
8
departures a day
71.5%
load factor
Airlines
Alaska Airlines is the largest carrier at Deadhorse, with 95% of all passengers. 9 airlines fly from here.
Share of passengers · each carrier as a slice of the whole airport
Alaska Airlines holds 95% of the airport — the 9th most concentrated of 120 non-hub airports. The nearest comparison is PAE at 96%.
| Airline | Share | Passengers | Seats YoY | |
|---|---|---|---|---|
AS | 95.5% | 194.8K | 1 | -2.4% |
8V Wright Air Service34% full | 2.4% | 4.9K | 5 | — |
5V Everts Air Cargo5% full | 1.4% | 2.9K | — | — |
X5 Junipogo11% full | 0.4% | 847 | 2 | — |
4W Warbelow42% full | 0.2% | 418 | — | — |
Share, passengers and destinations count each airline’s own flights plus the regional flying sold under its brand. Seats year on year compares the latest twelve months against the twelve before them.
Destinations
6 domestic and 1 international nonstop destinations from Deadhorse, across 1 countries.
100% domestic · 0% international · by departing passengers
Top domestic destinations
Top international destinations
AA8 (AA8)
1212 departing · 1515 both ways
Junipogo
All nonstop destinations
7 nonstop · 3 airlines · 6 domestic / 1 intl
Aircraft
By share of departures at Deadhorse.
Body class · share of departures
Cessna 208 Caravan
936 departures · 34% full
33.2%
Cessna C206
384 departures · 12% full
13.6%
Piper PA-31
381 departures · 28% full
13.5%
- Narrowbody
369 departures · 73% full
13.1%
- Narrowbody
176 departures · 73% full
6.2%
- Narrowbody
160 departures · 70% full
5.7%
- Narrowbody
153 departures · 71% full
5.4%
Beech 200 Super Kingair
130 departures · 0% full
4.6%
- Regional
53 departures · 83% full
1.9%
Cessna Skycourier 408
37 departures · 5% full
1.3%
When Deadhorse is busiest
Departures by month over the trailing year. Bars scale to the busiest month.
Aug
Sep
Oct
Nov
Dec
Jan
Feb
Mar
Apr
May
Jun
Jul
Departures a month · peak July 2026
Annual passengers since 1990
Total passengers, arriving and departing, in every year on record.
Passengers a year
Every year
- 1990
- 139,587
- 1991
- 126,776
- 1992
- 126,699
- 1993
- 110,291
- 1994
- 96,717
- 1995
- 53,667
- 1996
- 21,030
- 1997
- 18,629
- 1998
- 24,834
- 1999
- 22,425
- 2000
- 22,219
- 2001
- 29,763
- 2002
- 34,468
- 2003
- 30,804
- 2004
- 30,747
- 2005
- 28,896
- 2006
- 69,677
- 2007
- 130,195
- 2008
- 223,123
- 2009
- 82,468
- 2010
- 91,889
- 2011
- 93,859
- 2012
- 106,950
- 2013
- 135,524
- 2014
- 172,685
- 2015
- 223,232
- 2016
- 156,492
- 2017
- 134,034
- 2018
- 159,454
- 2019
- 213,363
- 2020
- 148,772
- 2021
- 129,665
- 2022
- 148,174
- 2023
- 167,544
- 2024
- 196,553
- 2025
- 214,166
- 2026
- 116,934 so far
Frequently asked
How busy is Deadhorse Airport (SCC)?
Deadhorse Airport handled about 204K passengers over the trailing 12 months, ranking #216 among U.S. airports by passengers, with roughly 8 departures a day.
Which airline is the largest at Deadhorse Airport (SCC)?
Alaska Airlines is the largest carrier at Deadhorse (SCC), flying about 95% of its passengers. 9 airlines serve Deadhorse in total.
How many places can you fly nonstop from Deadhorse Airport (SCC)?
Deadhorse (SCC) has 7 nonstop destinations — 6 domestic and 1 international across 1 countries.
What aircraft flies most from Deadhorse Airport (SCC)?
The Cessna 208 Caravan flew the largest share of departures from Deadhorse (SCC), about 33% of the total.
Departing counts passengers leaving Deadhorse; international destinations also show both directions. Data: traffic August 2025 – July 2026. Source: US DOT Bureau of Transportation Statistics (T-100 Segment).