Columbus
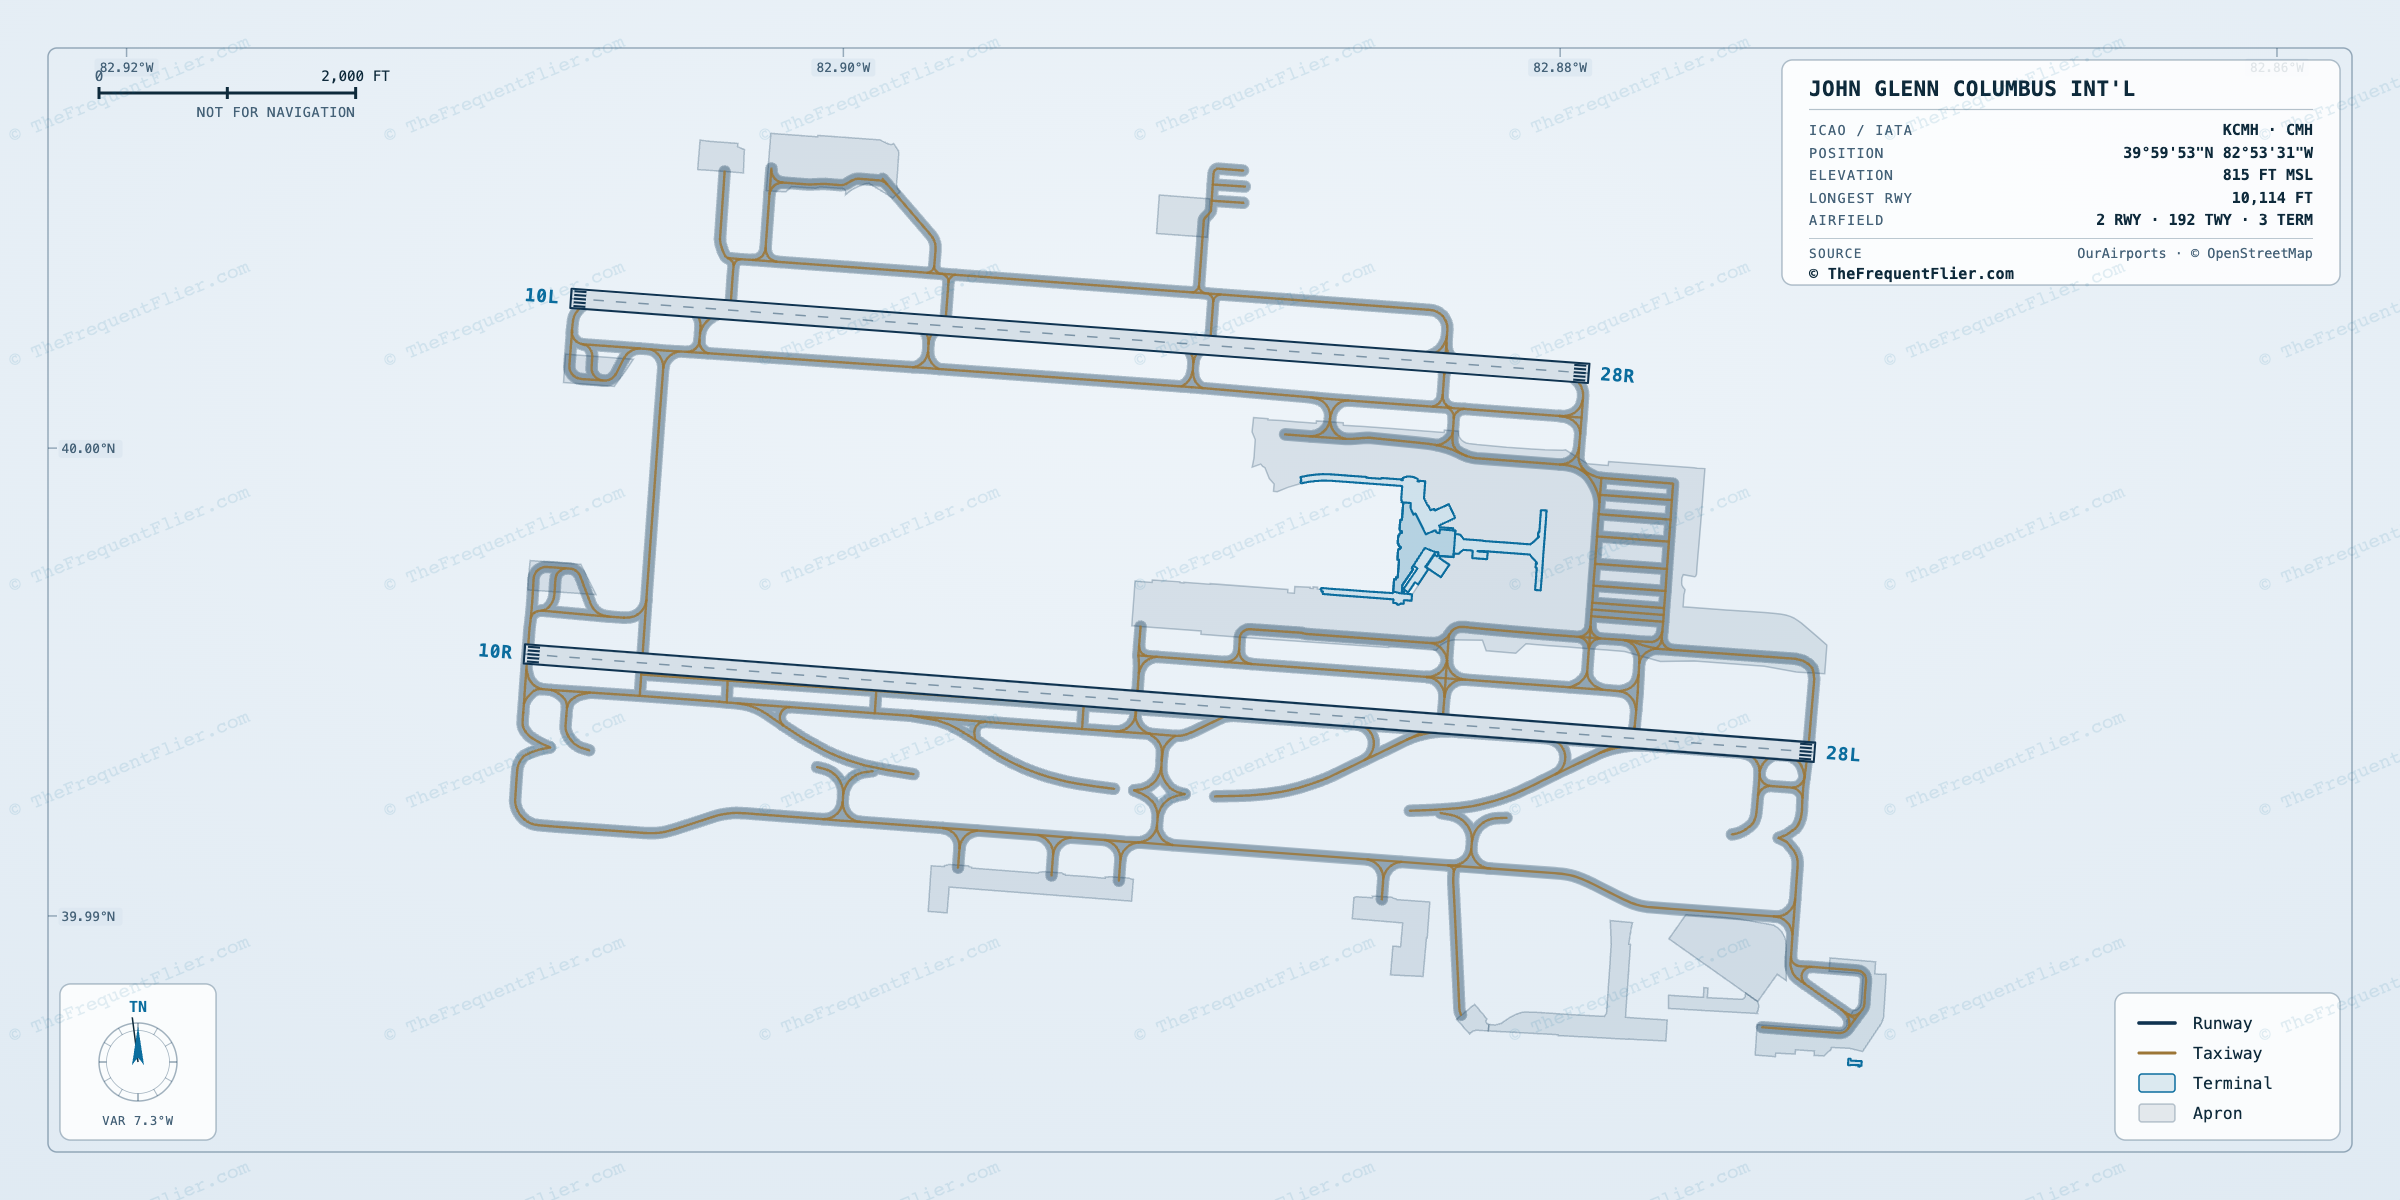
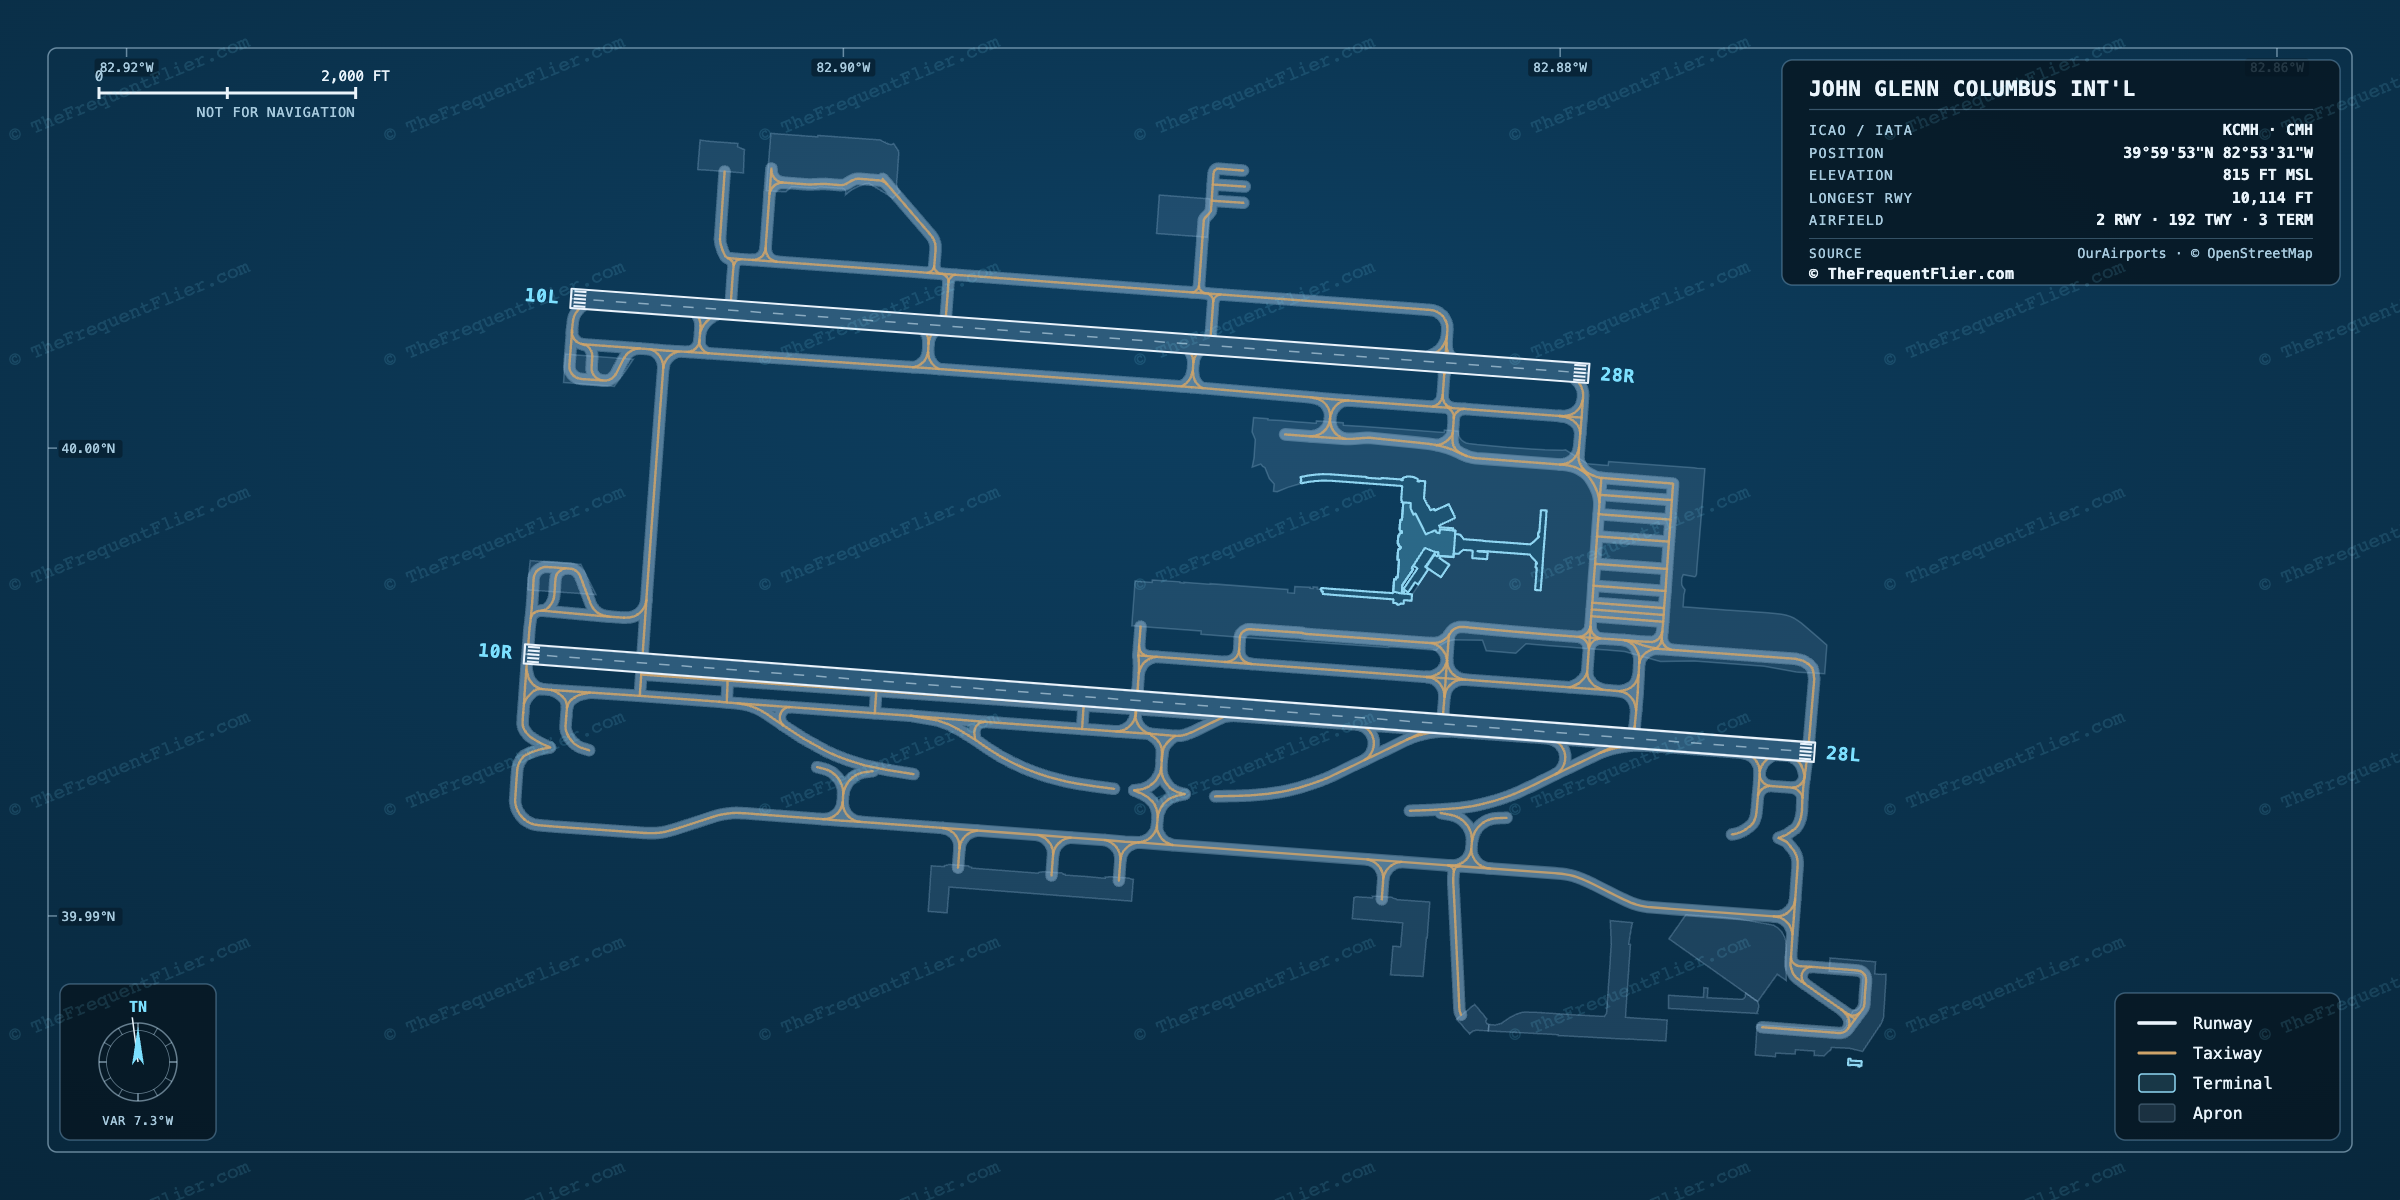
CMH · KCMHJohn Glenn Columbus International Airport
Passengers a year
8.8M
#47 busiest in the U.S.
51
nonstop destinations
40
airlines
133
departures a day
77.5%
arrivals on time
2.1%
flights cancelled
76.3%
load factor
Airlines
Southwest Airlines is the largest carrier at Columbus, with 32% of all passengers. 40 airlines fly from here.
Share of passengers · each carrier as a slice of the whole airport
Southwest Airlines holds 32% of the airport — the 21st most concentrated of 35 medium hubs. The nearest comparison is MSY at 34%.
| Airline | Share | Passengers | Seats YoY | ||
|---|---|---|---|---|---|
WN Southwest73% full | 31.9% | 2.8M | 23 | 75.1% | +3.4% |
AA | 25.0% | 2.2M | 12 | 73.5% | +7.4% |
DL | 18.4% | 1.6M | 8 | 81% | +7.4% |
UA | 14.9% | 1.3M | 7 | 78.3% | +12.3% |
NK Spirit71% full | 3.2% | 280.8K | 5 | — | -56.1% |
+Other airlines | 6.7% | 591.5K | — | — | — |
Share, passengers and destinations count each airline’s own flights plus the regional flying sold under its brand. On-time covers the airline's own aircraft only — regional affiliates report to the government separately. Seats year on year compares the latest twelve months against the twelve before them.
Destinations
48 domestic and 3 international nonstop destinations from Columbus, across 3 countries.
99% domestic · 1% international · by departing passengers
Top domestic destinations
Delta Air Lines · Southwest Airlines · Frontier Airlines
United Airlines · American Airlines
Southwest Airlines · Spirit Airlines · Frontier Airlines
Southwest Airlines · United Airlines · Frontier Airlines
206.6K206,610 departing · 81% full
American Airlines
American Airlines
Delta Air Lines · American Airlines · Spirit Airlines
American Airlines · Southwest Airlines
Southwest Airlines
Southwest Airlines · Spirit Airlines
All nonstop destinations
51 nonstop · 10 airlines · 48 domestic / 3 intl
Air Canada Express · operated by Jazz Aviation
American Eagle · operated by Envoy Air, PSA Airlines, Piedmont Airlines, Republic Airways, SkyWest Airlines
United Express · operated by CommuteAir, GoJet Airlines, Mesa Airlines, Republic Airways, SkyWest Airlines
Aircraft
By share of departures at Columbus.
Body class · share of departures
- Regional
16,454 departures · 78% full
34.0%
- Narrowbody
7,459 departures · 77% full
15.4%
- Narrowbody
5,163 departures · 77% full
10.7%
- Narrowbody
4,823 departures · 72% full
10.0%
- Regional
2,673 departures · 81% full
5.5%
- Narrowbody
2,019 departures · 80% full
4.2%
- Narrowbody
1,674 departures · 79% full
3.5%
- Narrowbody
1,583 departures · 80% full
3.3%
- Regional
1,125 departures · 82% full
2.3%
- Narrowbody
990 departures · 71% full
2.0%
When Columbus is busiest
Departures by month over the trailing year. Bars scale to the busiest month.
Aug
Sep
Oct
Nov
Dec
Jan
Feb
Mar
Apr
May
Jun
Jul
Departures a month · peak July 2026
Annual passengers since 1990
Total passengers, arriving and departing, in every year on record.
Passengers a year
Every year
- 1990
- 3,504,229
- 1991
- 3,275,817
- 1992
- 4,926,738
- 1993
- 5,439,705
- 1994
- 5,969,683
- 1995
- 6,088,546
- 1996
- 6,703,822
- 1997
- 6,929,333
- 1998
- 6,523,105
- 1999
- 6,444,087
- 2000
- 6,349,315
- 2001
- 5,841,363
- 2002
- 5,889,994
- 2003
- 6,188,427
- 2004
- 6,212,684
- 2005
- 6,657,587
- 2006
- 6,746,488
- 2007
- 7,747,707
- 2008
- 6,796,639
- 2009
- 6,257,373
- 2010
- 6,374,950
- 2011
- 6,386,709
- 2012
- 6,289,620
- 2013
- 6,191,747
- 2014
- 6,327,960
- 2015
- 6,741,299
- 2016
- 7,253,243
- 2017
- 7,491,590
- 2018
- 8,042,116
- 2019
- 8,472,943
- 2020
- 3,234,837
- 2021
- 5,724,082
- 2022
- 7,338,595
- 2023
- 8,311,822
- 2024
- 8,836,628
- 2025
- 8,826,280
- 2026
- 5,117,466 so far
Arriving on time
Of every 100 flights landing at Columbus, 78 touch down within 15 minutes of schedule, 20 arrive late, and 2 are cancelled.
Every 100 arrivals
16 min
average delay
944
flights cancelled
43.7K
arrivals measured
What holds flights up
Share of delay minutes
Most reliable here
Delta Air Lines 81%
Least reliable here
American Airlines 73.5%
Among US airports
#47
On time, month by month
A
S
O
N
D
J
F
M
A
M
J
J
Darker is better · 71.3%–83.2%
The weak spot is July 2026, when 71.3% of arrivals landed on time — 6.2 points below the year. The strongest was September 2025 at 83.2%.
Frequently asked
How busy is John Glenn Columbus International Airport (CMH)?
John Glenn Columbus International Airport handled about 8.8M passengers over the trailing 12 months, ranking #47 among U.S. airports by passengers, with roughly 133 departures a day.
Which airline is the largest at John Glenn Columbus International Airport (CMH)?
Southwest Airlines is the largest carrier at Columbus (CMH), flying about 32% of its passengers. 40 airlines serve Columbus in total.
How many places can you fly nonstop from John Glenn Columbus International Airport (CMH)?
Columbus (CMH) has 51 nonstop destinations — 48 domestic and 3 international across 3 countries.
How often do flights arrive on time at John Glenn Columbus International Airport (CMH)?
About 77.5% of flights arriving at Columbus (CMH) touch down within 15 minutes of schedule, per US DOT figures. About 2.1% are cancelled.
What aircraft flies most from John Glenn Columbus International Airport (CMH)?
The Embraer E175 flew the largest share of departures from Columbus (CMH), about 34% of the total.
Trip reports on YouTube
Fliers post trip reports from flights through Columbus (CMH) to YouTube. These three were matched automatically from public YouTube listings — The Frequent Flier does not host, review, or endorse them.
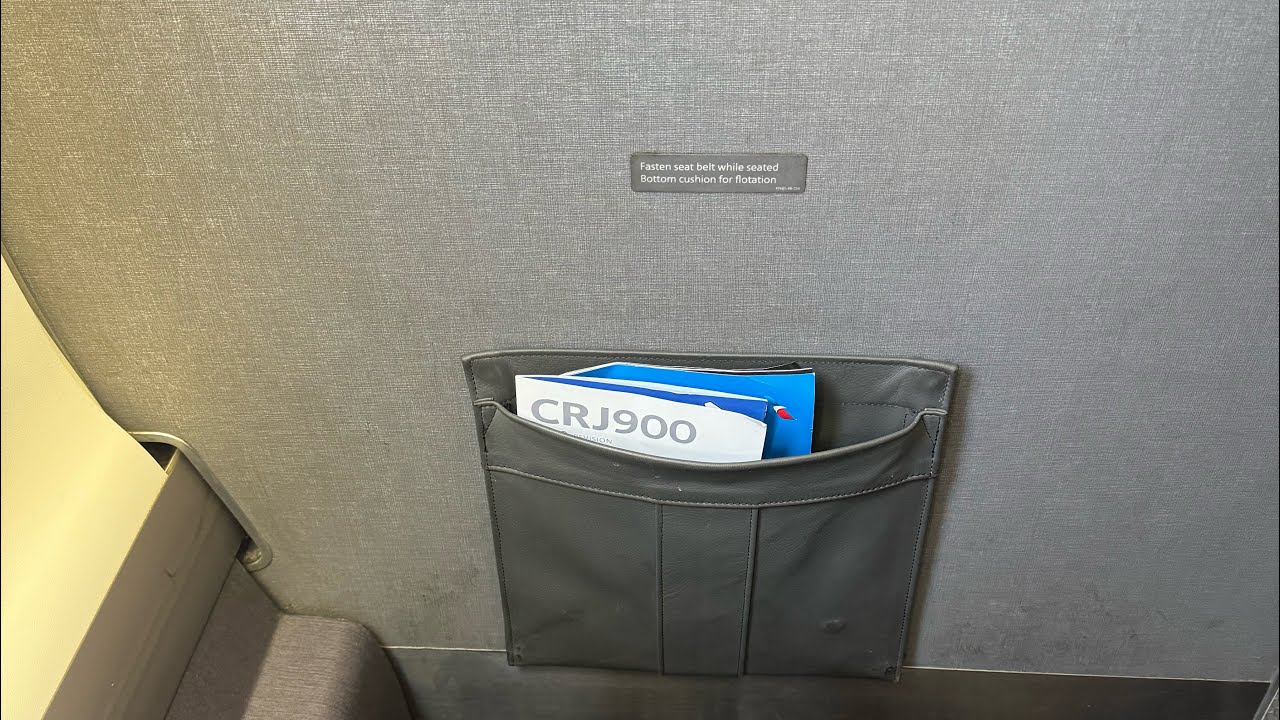
BrandonJohnson10K
American Airlines First Class CLT-CMH CRJ900 Trip Report
6:28 · Oct 2024

Miles By Foot
Full Flight Experience - Columbus, OH (CMH) to Philadelphia (PHL)
11:08 · Mar 2018

OrlandoAviation
TRIP REPORT | Southwest Airlines 737-700 (ECONOMY) | Orlando (MCO) – Columbus John Glenn (CMH)
9:27 · Jan 2020
Source: YouTube. Titles, thumbnails, and channel names come from YouTube. Playing a video loads the YouTube player, and using it means you agree to the YouTube Terms of Service; the Google Privacy Policy applies.
Departing counts passengers leaving Columbus; international destinations also show both directions. Data: traffic August 2025 – July 2026, on-time August 2025 – July 2026. Source: US DOT Bureau of Transportation Statistics (T-100 Segment, On-Time Performance).