Las Vegas
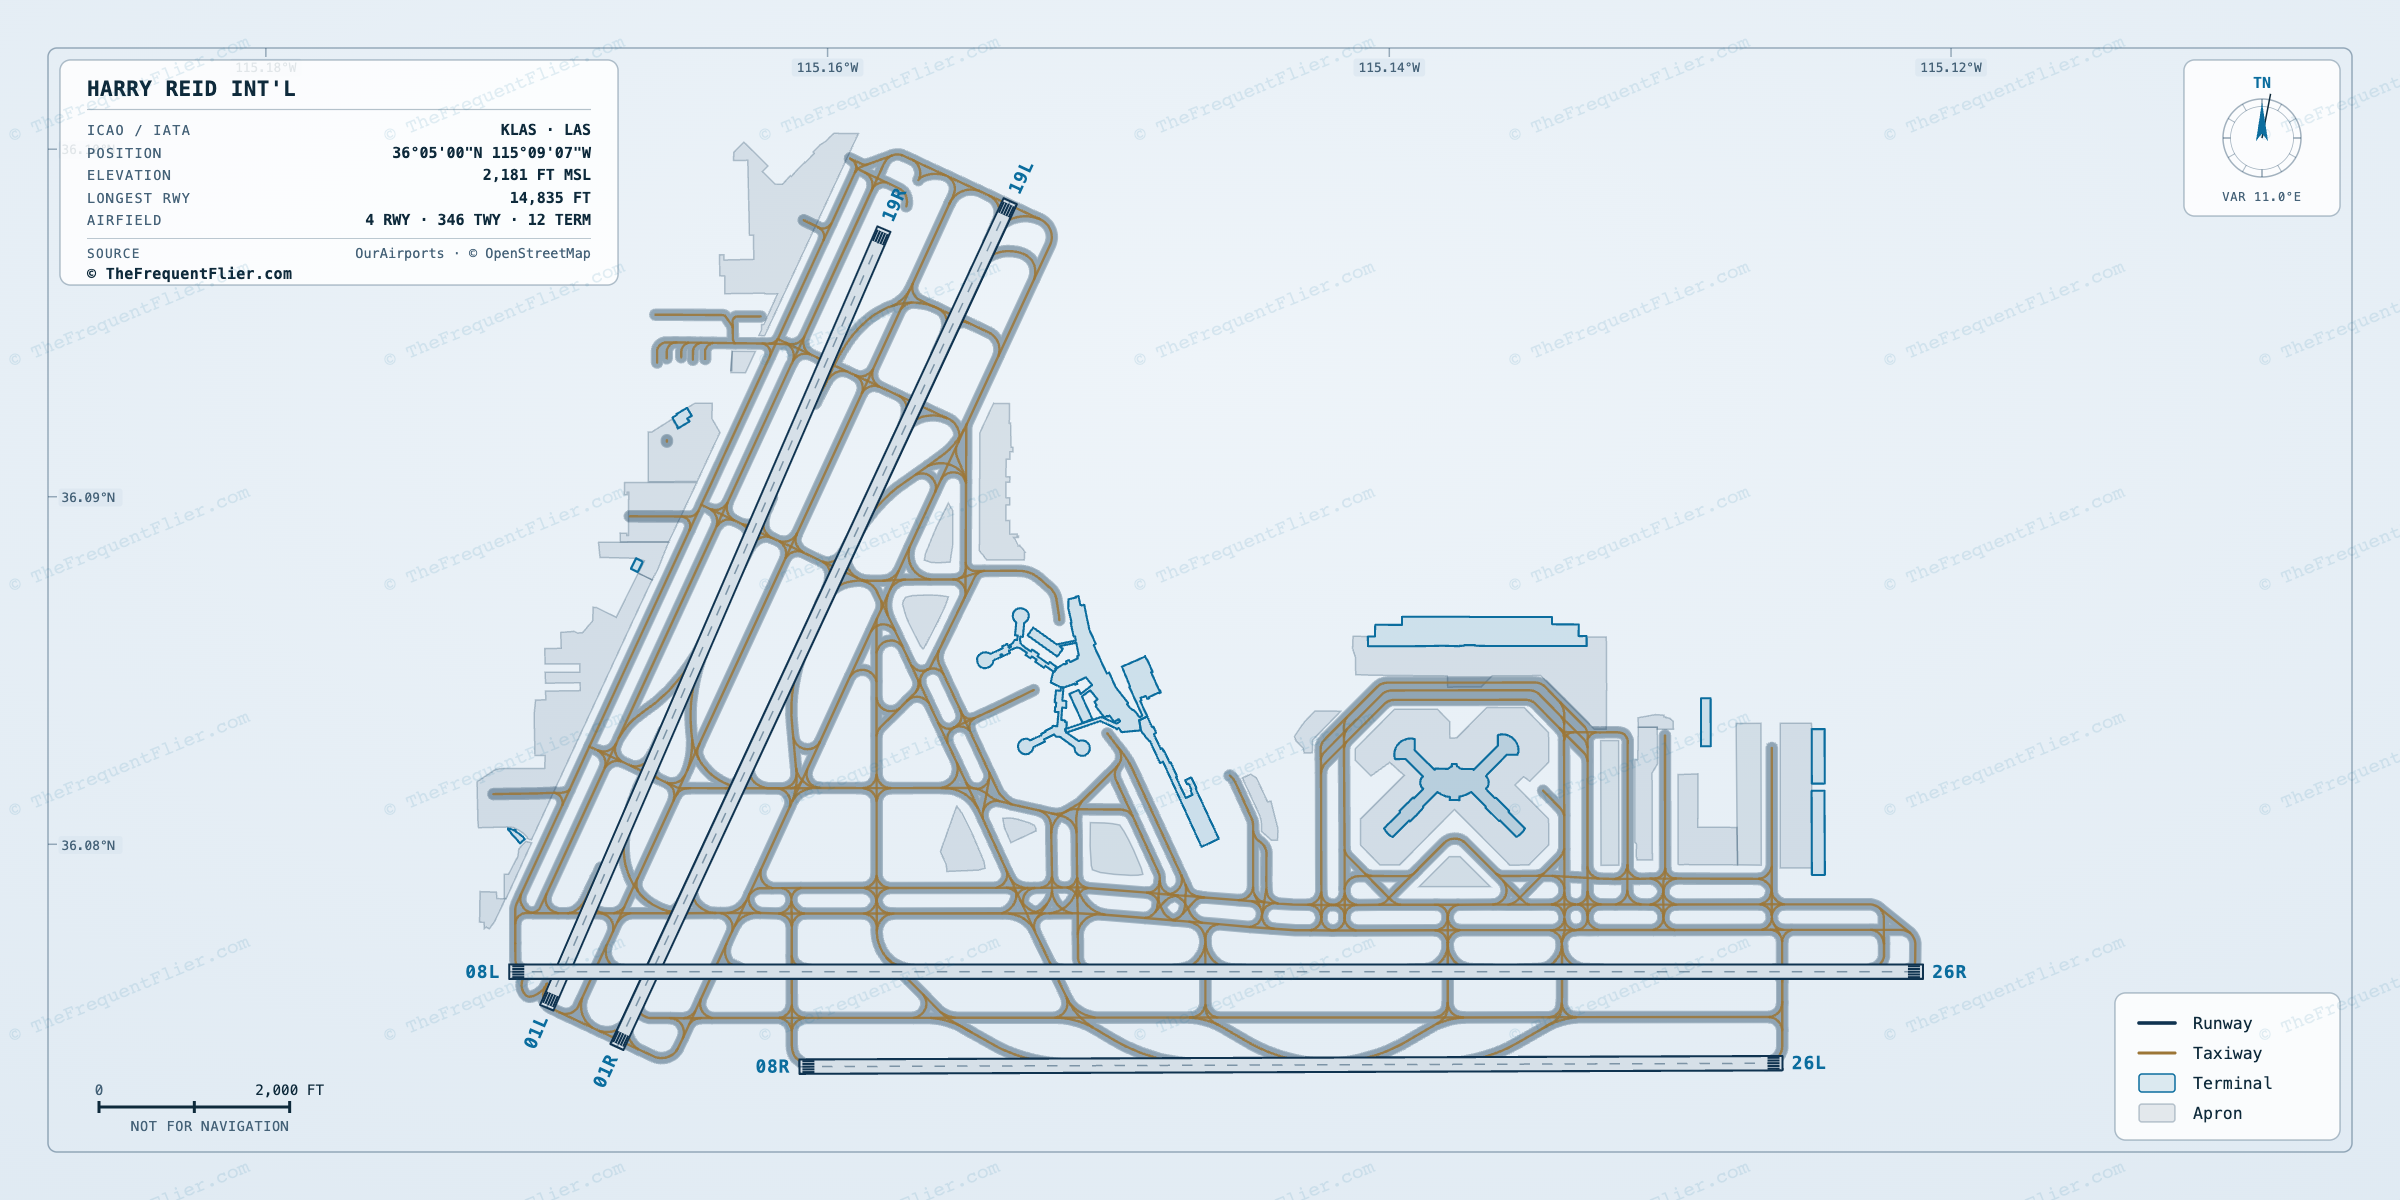
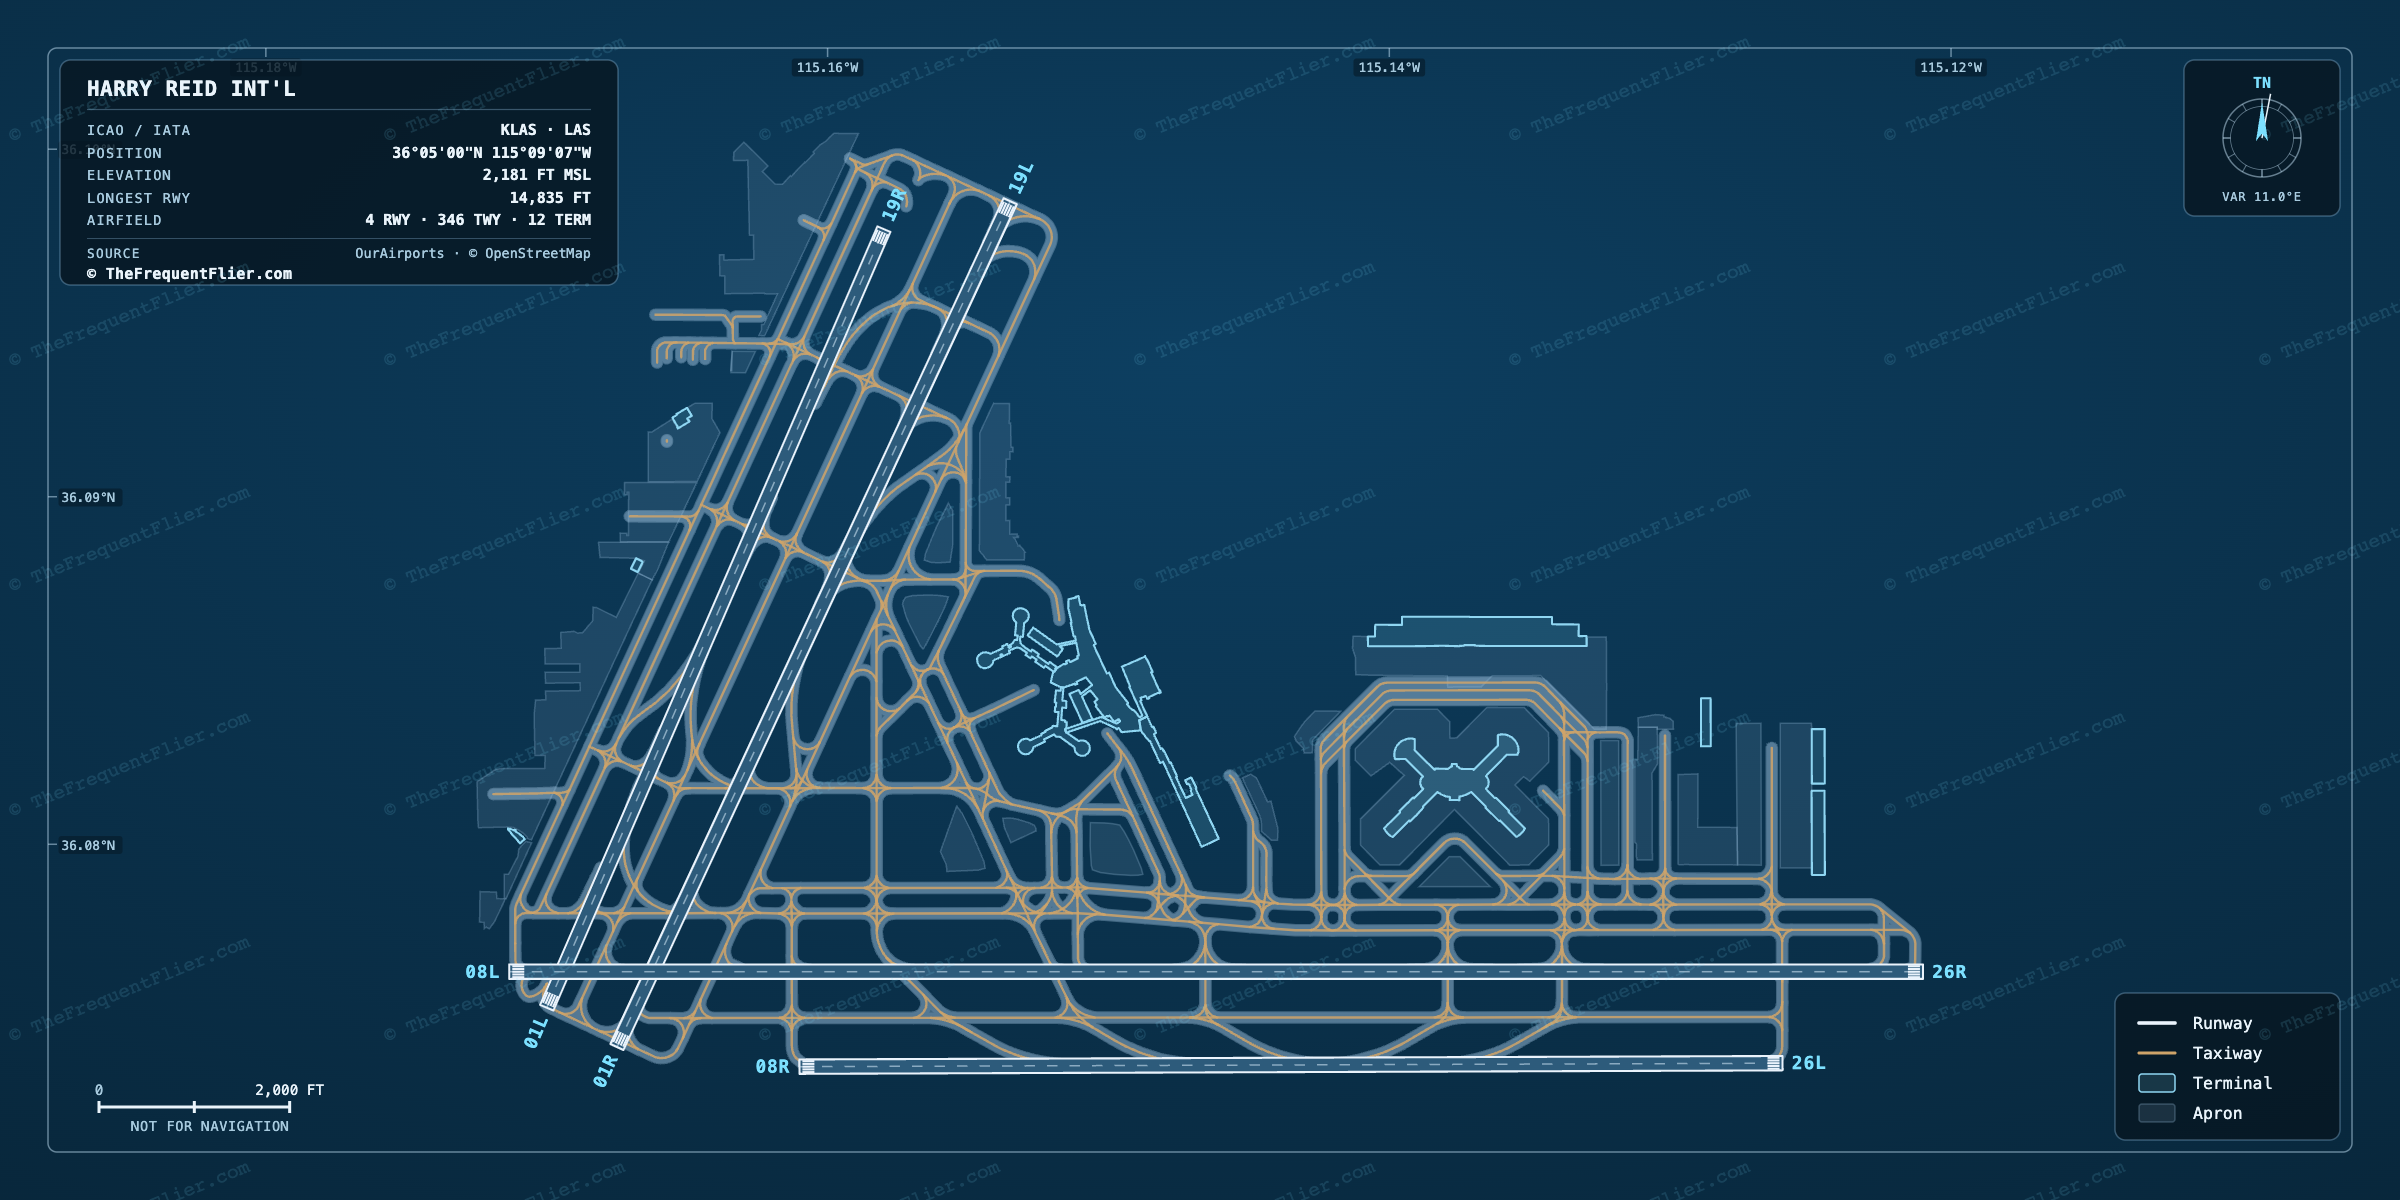
LAS · KLASHarry Reid International Airport
Passengers a year
51M
#10 busiest in the U.S.
170
nonstop destinations
73
airlines
538
departures a day
78.3%
arrivals on time
0.9%
flights cancelled
81.8%
load factor
Airlines
Southwest Airlines is the largest carrier at Las Vegas, with 42% of all passengers. 73 airlines fly from here.
Share of passengers · each carrier as a slice of the whole airport
Southwest Airlines holds 42% of the airport — the 20th most concentrated of 30 large hubs. The nearest comparison is LGA at 43%.
| Airline | Share | Passengers | Seats YoY | ||
|---|---|---|---|---|---|
WN Southwest80% full | 42.1% | 21.5M | 74 | 78.6% | 0% |
DL | 9.8% | 5M | 15 | 79.1% | -4% |
UA | 8.5% | 4.4M | 7 | 81.7% | +1.8% |
AA | 8.4% | 4.3M | 10 | 72.9% | -5.7% |
F9 Frontier80% full | 8.1% | 4.1M | 36 | 73.4% | +2% |
+Other airlines | 23.1% | 11.8M | — | — | — |
Share, passengers and destinations count each airline’s own flights plus the regional flying sold under its brand. On-time covers the airline's own aircraft only — regional affiliates report to the government separately. Seats year on year compares the latest twelve months against the twelve before them.
Destinations
143 domestic and 27 international nonstop destinations from Las Vegas, across 13 countries.
94% domestic · 6% international · by departing passengers
Top domestic destinations
1.1M1,115,695 departing · 76% full
Southwest Airlines · Delta Air Lines · United Airlines · American Airlines · Frontier Airlines · Spirit Airlines
Southwest Airlines · United Airlines · Frontier Airlines
854.1K854,090 departing · 80% full
United Airlines · Southwest Airlines · Frontier Airlines · Alaska Airlines
Delta Air Lines · Frontier Airlines · Southwest Airlines · Spirit Airlines
804.9K804,916 departing · 84% full
American Airlines · Frontier Airlines · Spirit Airlines
Alaska Airlines · Delta Air Lines · Southwest Airlines · Frontier Airlines
United Airlines · American Airlines · Southwest Airlines · Frontier Airlines · Spirit Airlines
Southwest Airlines · American Airlines · Frontier Airlines
Southwest Airlines · Alaska Airlines · Frontier Airlines · Delta Air Lines · Spirit Airlines
Delta Air Lines · JetBlue Airways · American Airlines · Frontier Airlines
Top international destinations
London, United Kingdom (LHR)
215.5K215,513 departing · 435.7K435,725 both ways
British Airways · Virgin Atlantic
Mexico City, Mexico (MEX)
193.3K193,315 departing · 382.8K382,792 both ways
Viva · Volaris · Aeroméxico
Toronto, Canada (YYZ)
182.4K182,373 departing · 368.4K368,433 both ways
Air Canada Rouge · Porter Airlines · WestJet · Air Canada
Guadalajara, Mexico (GDL)
153.4K153,441 departing · 310.4K310,411 both ways
Volaris · Viva
Vancouver, Canada (YVR)
142.4K142,396 departing · 287.9K287,850 both ways
WestJet · Air Canada · Air Canada Rouge · Flair Airlines
Calgary, Canada (YYC)
126.5K126,527 departing · 250.8K250,831 both ways
WestJet
Seoul, South Korea (ICN)
88.2K88,168 departing · 180.7K180,664 both ways
Korean Air
Monterrey, Mexico (MTY)
74K74,028 departing · 151.4K151,428 both ways
Viva · Aeroméxico
Amsterdam, Netherlands (AMS)
68.3K68,307 departing · 138.1K138,112 both ways
KLM
Montréal, Canada (YUL)
51.7K51,653 departing · 102.2K102,187 both ways
Air Canada Rouge · Air Canada
All nonstop destinations
170 nonstop · 35 airlines · 143 domestic / 27 intl
Aircraft
By share of departures at Las Vegas.
Body class · share of departures
- Narrowbody
39,505 departures · 81% full
20.1%
- Narrowbody
32,258 departures · 81% full
16.4%
- Narrowbody
31,914 departures · 81% full
16.3%
- Narrowbody
16,005 departures · 81% full
8.2%
- Narrowbody
14,131 departures · 83% full
7.2%
- Narrowbody
10,546 departures · 82% full
5.4%
Embraer ERJ-135
9,174 departures · 71% full
4.7%
- Narrowbody
7,479 departures · 82% full
3.8%
- Narrowbody
6,811 departures · 80% full
3.5%
- Narrowbody
5,665 departures · 83% full
2.9%
When Las Vegas is busiest
Departures by month over the trailing year. Bars scale to the busiest month.
Aug
Sep
Oct
Nov
Dec
Jan
Feb
Mar
Apr
May
Jun
Jul
Departures a month · peak October 2025
Annual passengers since 1990
Total passengers, arriving and departing, in every year on record.
Passengers a year
Every year
- 1990
- 16,350,194
- 1991
- 17,251,598
- 1992
- 17,449,035
- 1993
- 18,773,819
- 1994
- 22,245,737
- 1995
- 24,107,972
- 1996
- 27,352,426
- 1997
- 27,660,333
- 1998
- 27,495,576
- 1999
- 30,486,604
- 2000
- 33,840,951
- 2001
- 33,193,832
- 2002
- 33,134,092
- 2003
- 35,647,352
- 2004
- 41,005,924
- 2005
- 43,686,820
- 2006
- 45,171,498
- 2007
- 46,100,437
- 2008
- 43,146,467
- 2009
- 39,835,722
- 2010
- 38,920,808
- 2011
- 40,610,796
- 2012
- 40,695,251
- 2013
- 40,885,896
- 2014
- 41,769,835
- 2015
- 44,207,747
- 2016
- 46,112,456
- 2017
- 47,075,522
- 2018
- 48,140,143
- 2019
- 49,831,568
- 2020
- 21,605,834
- 2021
- 38,623,571
- 2022
- 51,412,422
- 2023
- 56,164,494
- 2024
- 56,730,182
- 2025
- 53,334,825
- 2026
- 29,197,211 so far
Arriving on time
Of every 100 flights landing at Las Vegas, 78 touch down within 15 minutes of schedule, 21 arrive late, and 1 is cancelled.
Every 100 arrivals
15 min
average delay
1,493
flights cancelled
171.2K
arrivals measured
What holds flights up
Share of delay minutes
Most reliable here
Spirit Airlines 82.8%
Least reliable here
American Airlines 72.9%
Among US airports
#10
On time, month by month
A
S
O
N
D
J
F
M
A
M
J
J
Darker is better · 70.6%–82.6%
The weak spot is June 2026, when 70.6% of arrivals landed on time — 7.7 points below the year. The strongest was February 2026 at 82.6%.
Frequently asked
How busy is Harry Reid International Airport (LAS)?
Harry Reid International Airport handled about 51M passengers over the trailing 12 months, ranking #10 among U.S. airports by passengers, with roughly 538 departures a day.
Which airline is the largest at Harry Reid International Airport (LAS)?
Southwest Airlines is the largest carrier at Las Vegas (LAS), flying about 42% of its passengers. 73 airlines serve Las Vegas in total.
How many places can you fly nonstop from Harry Reid International Airport (LAS)?
Las Vegas (LAS) has 170 nonstop destinations — 143 domestic and 27 international across 13 countries.
How often do flights arrive on time at Harry Reid International Airport (LAS)?
About 78.3% of flights arriving at Las Vegas (LAS) touch down within 15 minutes of schedule, per US DOT figures. About 0.9% are cancelled.
What aircraft flies most from Harry Reid International Airport (LAS)?
The Boeing 737 MAX 8 flew the largest share of departures from Las Vegas (LAS), about 20% of the total.
Trip reports on YouTube
Fliers post trip reports from flights through Las Vegas (LAS) to YouTube. These three were matched automatically from public YouTube listings — The Frequent Flier does not host, review, or endorse them.

QFS Aviation
Hawaiian Airlines - A330 200 - First Class - Las Vegas (LAS) to Honolulu (HNL) | TRIP REPORT
25:18 · Apr 2024

Genki's Travels
Air Canada Rouge | A319-100 | Rouge Class | Montreal (YUL) to Las Vegas (LAS) | Trip Report
22:00 · Dec 2023
Source: YouTube. Titles, thumbnails, and channel names come from YouTube. Playing a video loads the YouTube player, and using it means you agree to the YouTube Terms of Service; the Google Privacy Policy applies.
Departing counts passengers leaving Las Vegas; international destinations also show both directions. Data: traffic August 2025 – July 2026, on-time August 2025 – July 2026. Source: US DOT Bureau of Transportation Statistics (T-100 Segment, On-Time Performance).