Kailua-Kona
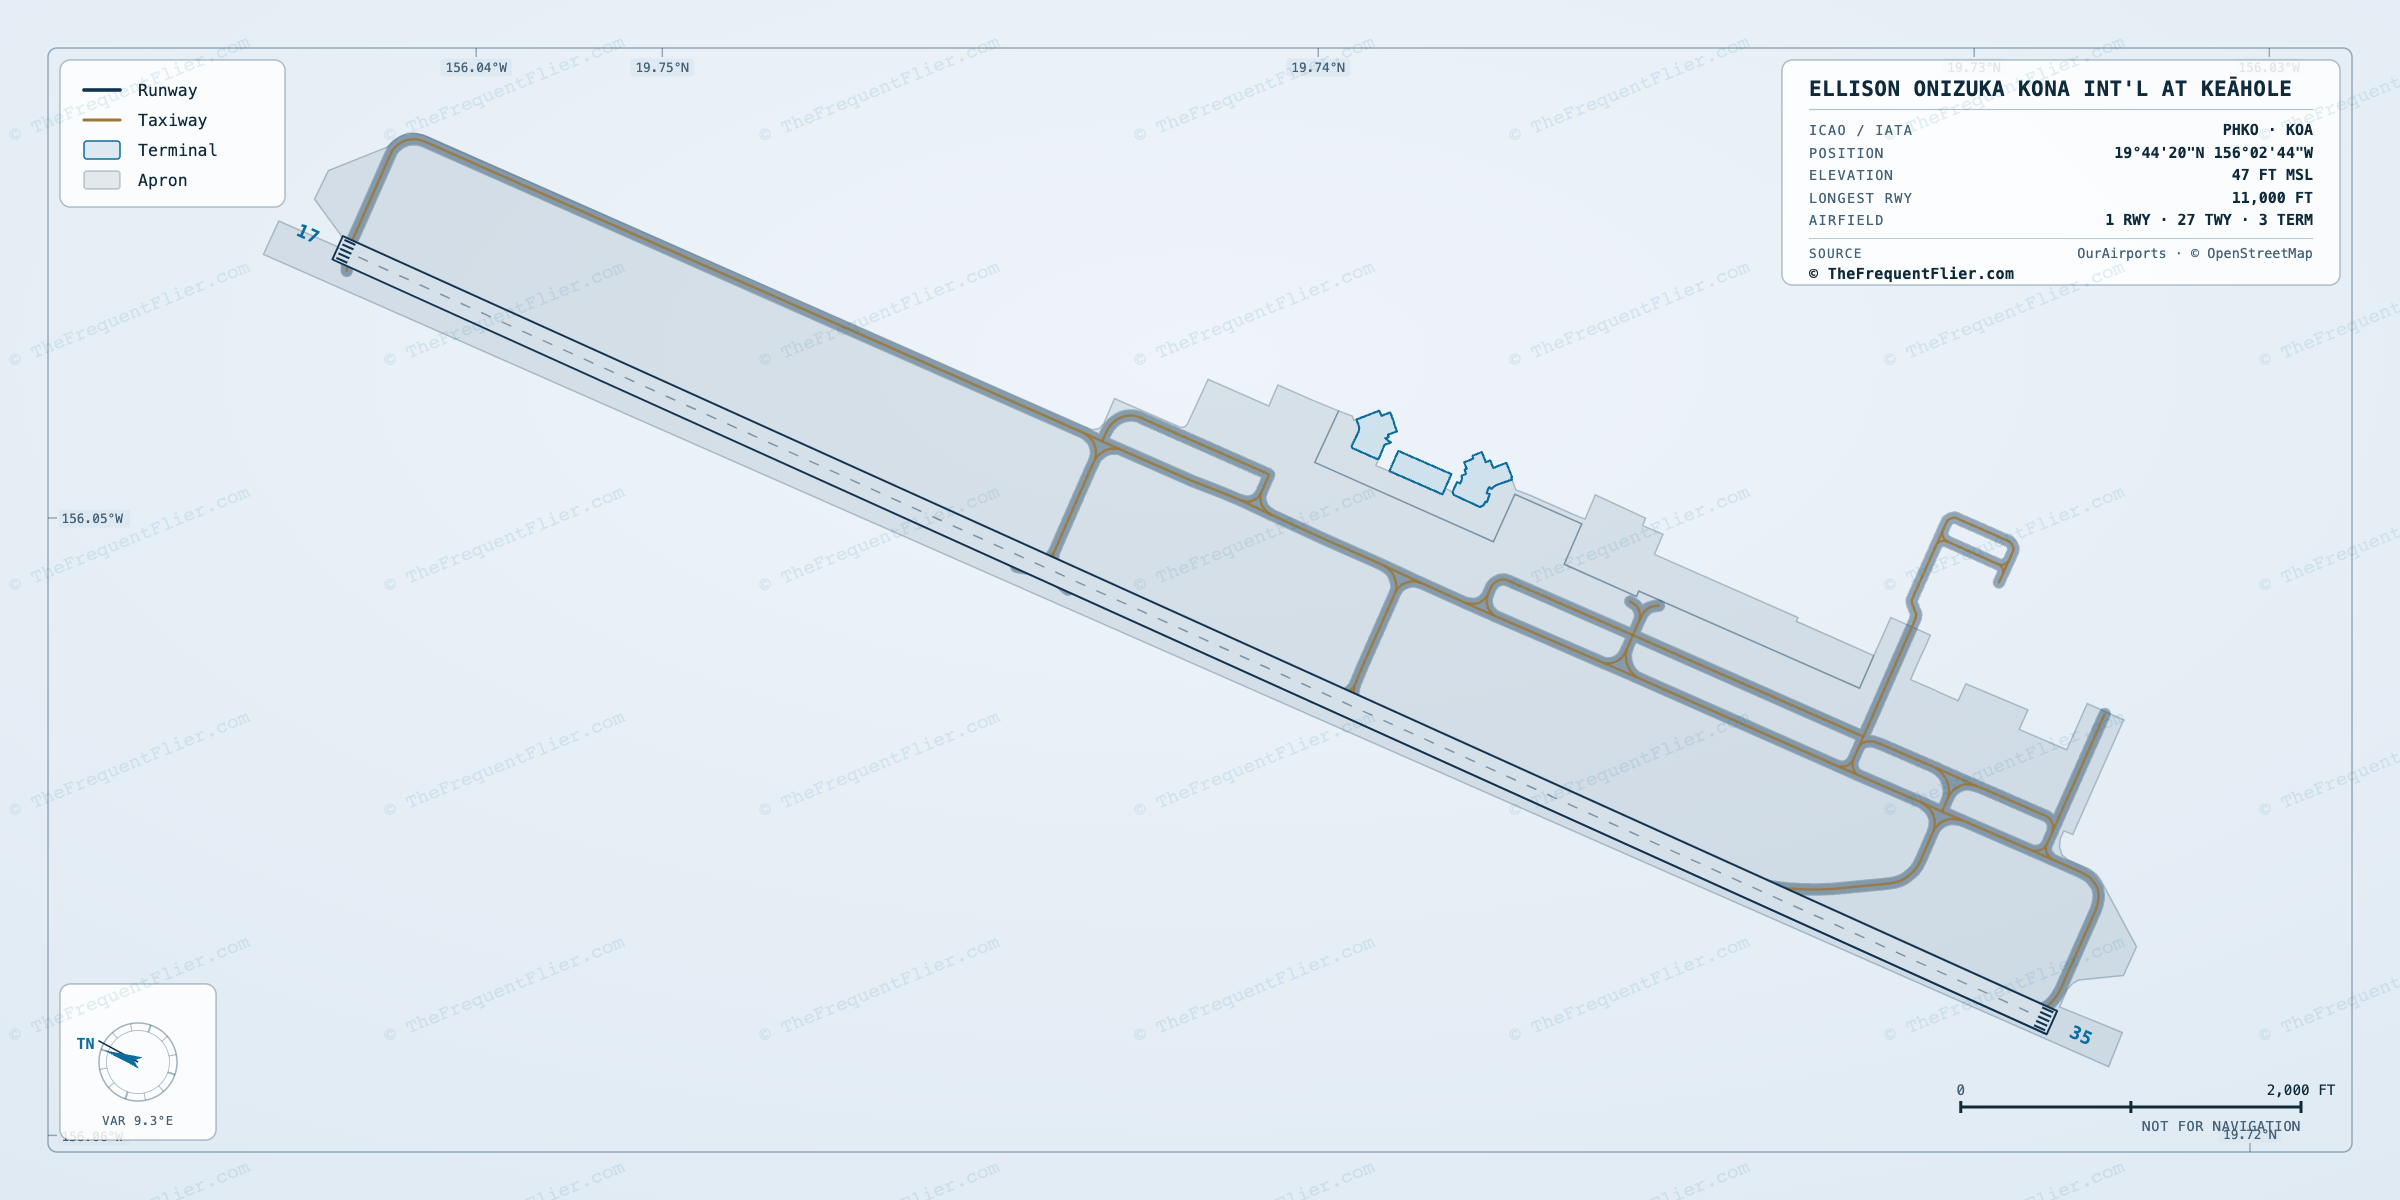
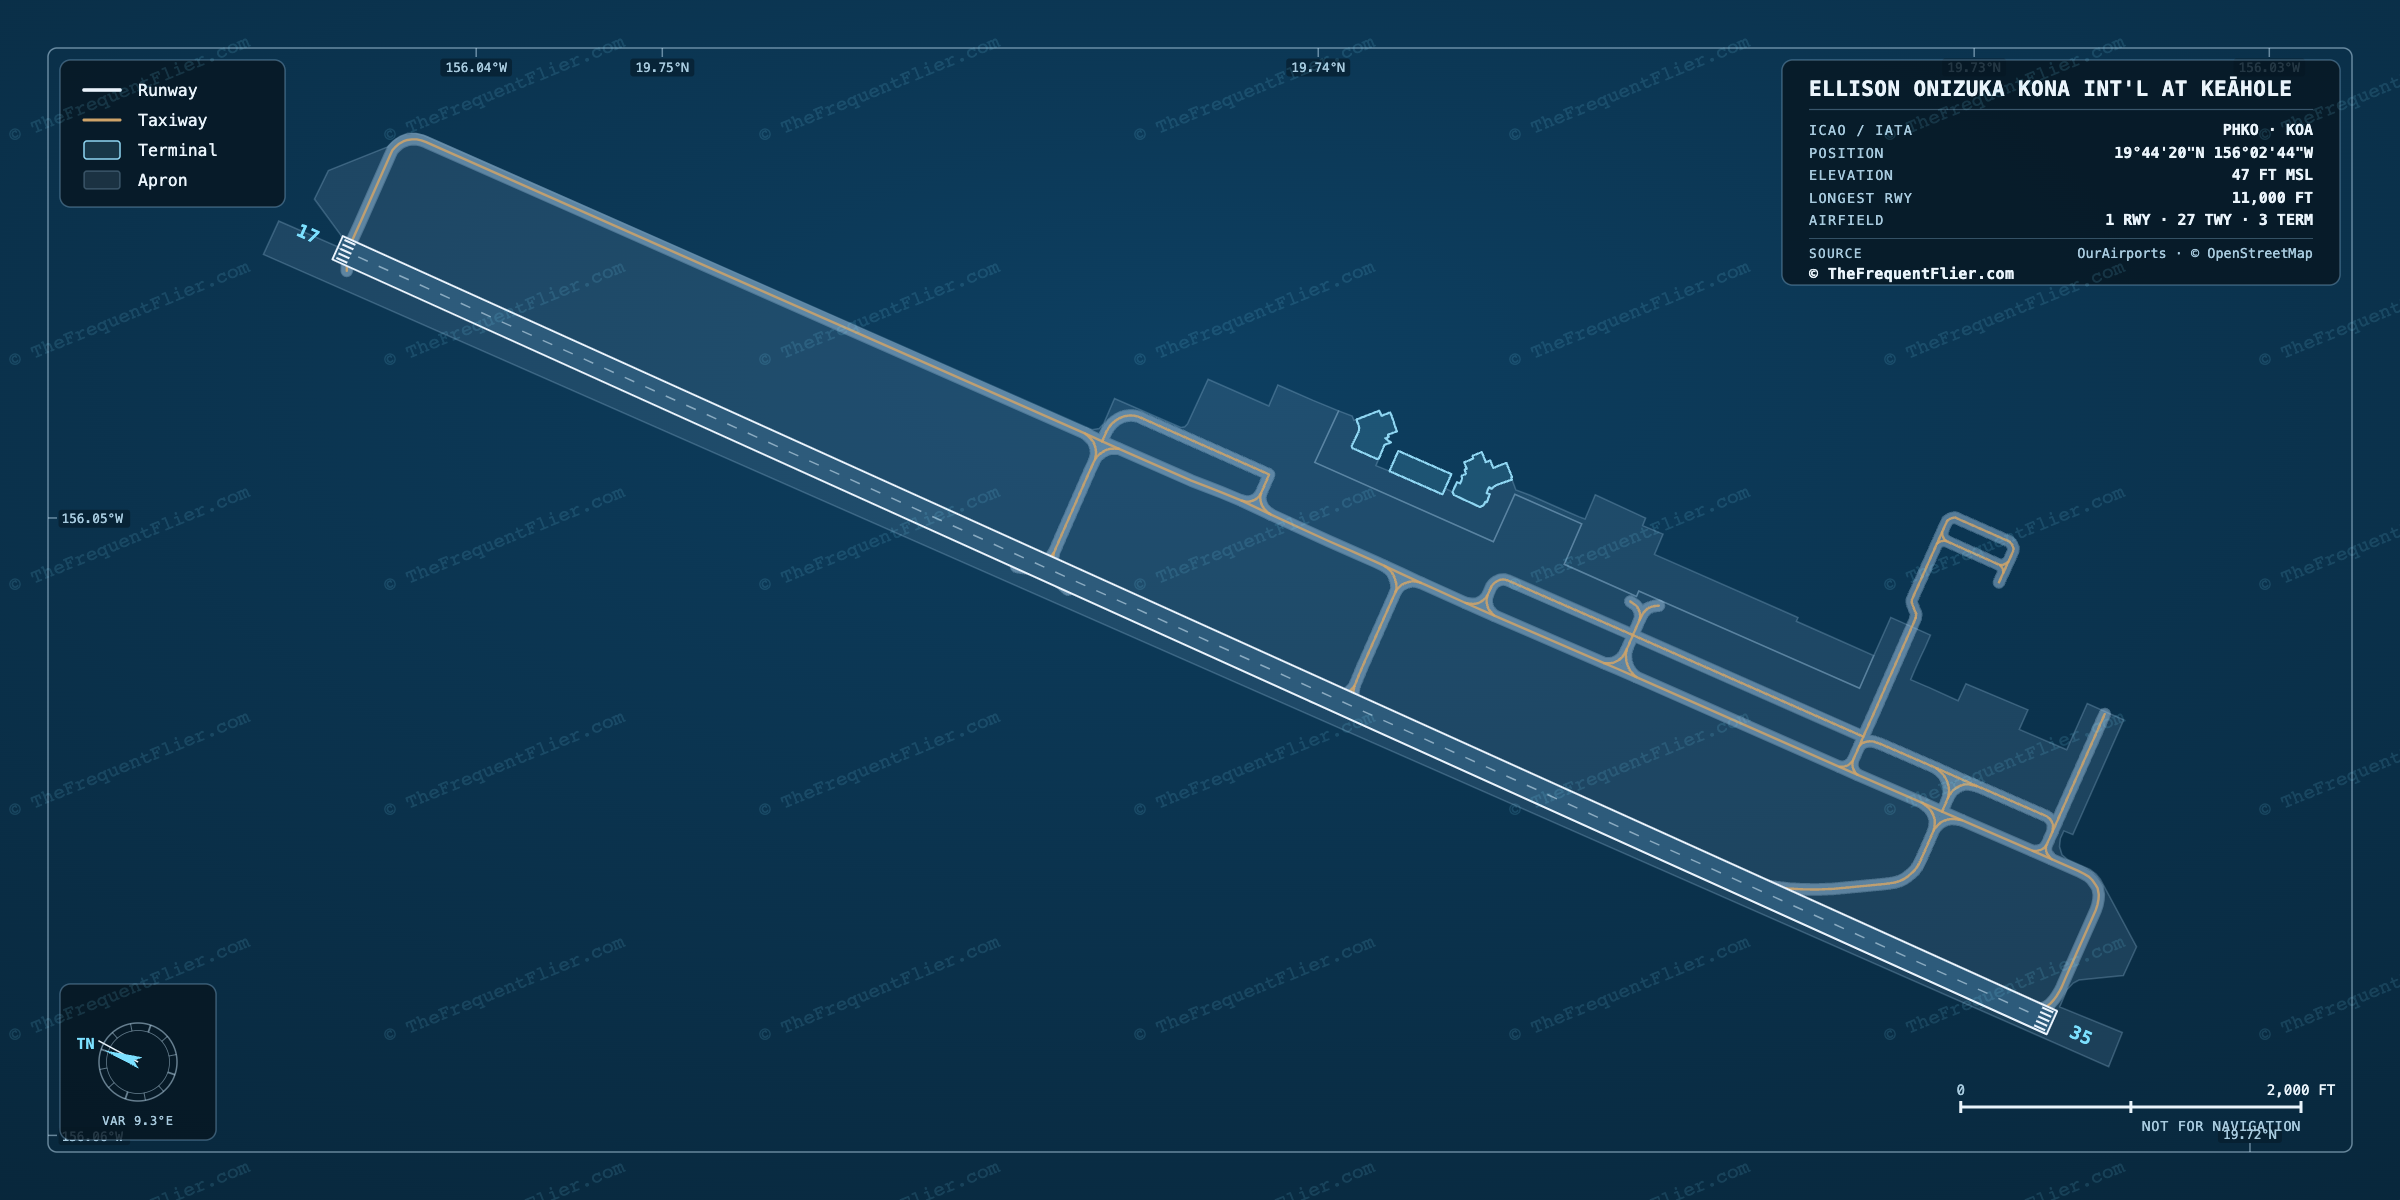
KOA · PHKOEllison Onizuka Kona International Airport at Keāhole
Passengers a year
4M
#74 busiest in the U.S.
20
nonstop destinations
18
airlines
46
departures a day
83.6%
arrivals on time
0.8%
flights cancelled
81.7%
load factor
Airlines
Alaska Airlines is the largest carrier at Kailua-Kona, with 38% of all passengers. 18 airlines fly from here.
Share of passengers · each carrier as a slice of the whole airport
Alaska Airlines holds 38% of the airport — the 35th most concentrated of 79 small hubs. The nearest comparison is ATW at 39%.
| Airline | Share | Passengers | Seats YoY | ||
|---|---|---|---|---|---|
AS Alaska82% full | 38.3% | 1.5M | 11 | 80% | +171.3% |
UA United81% full | 16.0% | 645.1K | 4 | 86.2% | +5.5% |
WN Southwest82% full | 15.4% | 621.3K | 4 | 89.4% | -9.2% |
HA Hawaiian74% full | 14.5% | 583.2K | 4 | 87.1% | -63.4% |
AA American85% full | 7.2% | 289.5K | 3 | 79.3% | +16.4% |
+Other airlines | 8.7% | 349.2K | — | — | — |
Share, passengers and destinations count each airline’s own flights plus the regional flying sold under its brand. On-time covers the airline's own aircraft only — regional affiliates report to the government separately. Seats year on year compares the latest twelve months against the twelve before them.
Destinations
18 domestic and 2 international nonstop destinations from Kailua-Kona, across 2 countries.
99% domestic · 1% international · by departing passengers
Top domestic destinations
698.8K698,751 departing · 70% full
Alaska Airlines · Hawaiian Airlines · Southwest Airlines
246.4K246,415 departing · 83% full
United Airlines · Delta Air Lines · American Airlines · Alaska Airlines
Alaska Airlines · Delta Air Lines
189K188,951 departing · 81% full
United Airlines · Alaska Airlines
Alaska Airlines · Hawaiian Airlines · Southwest Airlines
United Airlines
77.7K77,733 departing · 83% full
Southwest Airlines · Alaska Airlines · Hawaiian Airlines
American Airlines
Southwest Airlines
Alaska Airlines
All nonstop destinations
20 nonstop · 9 airlines · 18 domestic / 2 intl
Aircraft
By share of departures at Kailua-Kona.
Body class · share of departures
- Narrowbody
6,643 departures · 77% full
39.6%
- Narrowbody
3,562 departures · 83% full
21.3%
- Narrowbody
1,850 departures · 81% full
11.0%
- Narrowbody
1,644 departures · 84% full
9.8%
- Narrowbody
955 departures · 78% full
5.7%
- Narrowbody
406 departures · 81% full
2.4%
- Widebody
331 departures · 77% full
2.0%
Cessna C208B
323 departures · 33% full
1.9%
- Narrowbody
305 departures · 85% full
1.8%
- Narrowbody
304 departures · 87% full
1.8%
When Kailua-Kona is busiest
Departures by month over the trailing year. Bars scale to the busiest month.
Aug
Sep
Oct
Nov
Dec
Jan
Feb
Mar
Apr
May
Jun
Jul
Departures a month · peak January 2026
Annual passengers since 1990
Total passengers, arriving and departing, in every year on record.
Passengers a year
Every year
- 1990
- 2,027,770
- 1991
- 1,996,700
- 1992
- 2,031,586
- 1993
- 2,112,619
- 1994
- 2,171,974
- 1995
- 2,149,254
- 1996
- 2,322,145
- 1997
- 2,385,794
- 1998
- 2,502,702
- 1999
- 2,541,665
- 2000
- 2,684,943
- 2001
- 2,466,746
- 2002
- 2,453,614
- 2003
- 2,411,246
- 2004
- 2,612,032
- 2005
- 2,944,260
- 2006
- 3,123,455
- 2007
- 3,213,965
- 2008
- 2,819,712
- 2009
- 2,658,034
- 2010
- 2,552,607
- 2011
- 2,592,904
- 2012
- 2,736,227
- 2013
- 2,762,220
- 2014
- 2,803,576
- 2015
- 2,966,615
- 2016
- 3,134,183
- 2017
- 3,531,103
- 2018
- 3,641,696
- 2019
- 3,866,497
- 2020
- 1,237,183
- 2021
- 2,820,302
- 2022
- 4,012,957
- 2023
- 4,204,312
- 2024
- 4,048,094
- 2025
- 4,066,171
- 2026
- 2,420,195 so far
Arriving on time
Of every 100 flights landing at Kailua-Kona, 84 touch down within 15 minutes of schedule, 15 arrive late, and 1 is cancelled.
Every 100 arrivals
9 min
average delay
127
flights cancelled
15.9K
arrivals measured
What holds flights up
Share of delay minutes
Most reliable here
Southwest Airlines 89.4%
Least reliable here
Delta Air Lines 78.7%
Among US airports
#74
On time, month by month
A
S
O
N
D
J
F
M
A
M
J
J
Darker is better · 78.2%–90.7%
The weak spot is December 2025, when 78.2% of arrivals landed on time — 5.4 points below the year. The strongest was September 2025 at 90.7%.
Frequently asked
How busy is Ellison Onizuka Kona International Airport at Keāhole (KOA)?
Ellison Onizuka Kona International Airport at Keāhole handled about 4M passengers over the trailing 12 months, ranking #74 among U.S. airports by passengers, with roughly 46 departures a day.
Which airline is the largest at Ellison Onizuka Kona International Airport at Keāhole (KOA)?
Alaska Airlines is the largest carrier at Kailua-Kona (KOA), flying about 38% of its passengers. 18 airlines serve Kailua-Kona in total.
How many places can you fly nonstop from Ellison Onizuka Kona International Airport at Keāhole (KOA)?
Kailua-Kona (KOA) has 20 nonstop destinations — 18 domestic and 2 international across 2 countries.
How often do flights arrive on time at Ellison Onizuka Kona International Airport at Keāhole (KOA)?
About 83.6% of flights arriving at Kailua-Kona (KOA) touch down within 15 minutes of schedule, per US DOT figures. About 0.8% are cancelled.
What aircraft flies most from Ellison Onizuka Kona International Airport at Keāhole (KOA)?
The Boeing 717-200 flew the largest share of departures from Kailua-Kona (KOA), about 40% of the total.
Departing counts passengers leaving Kailua-Kona; international destinations also show both directions. Data: traffic August 2025 – July 2026, on-time August 2025 – July 2026. Source: US DOT Bureau of Transportation Statistics (T-100 Segment, On-Time Performance).